Your Private Backyard Oasis Awaits! Welcome to this exceptional home offering the ultimate blend of comfort, efficiency, and outdoor entertainment. Step outside into your own private resort featuring a sparkling swimming pool and a custom putting green perfect for weekend relaxing or hosting guests.
For sale
$540,000
3331 Maple Street, Visalia, CA 93292
4beds
2,665sqft
Single Family Residence, Residential
Built in 2007
0.28 Acres Lot
$-- Zestimate®
$203/sqft
$-- HOA
What's special
Private backyard oasisSparkling swimming poolCustom putting greenPrivate resort
- 28 days
- 937
- 122
Zillow last checked:
Listing updated:
Listed by:
Gabriel Correa 559-802-0315,
KW Venture
Source: TCMLS,MLS#: 244261
Facts & features
Interior
Bedrooms & bathrooms
- Bedrooms: 4
- Bathrooms: 3
- Full bathrooms: 2
- 1/2 bathrooms: 1
- Main level bathrooms: 1
Heating
- Central
Cooling
- Central Air
Features
- Has fireplace: No
Interior area
- Total structure area: 2,665
- Total interior livable area: 2,665 sqft
Property
Parking
- Total spaces: 2
- Parking features: RV Access/Parking
- Garage spaces: 2
Features
- Stories: 2
- Has private pool: Yes
- Pool features: Gunite
- Has spa: Yes
- Spa features: Above Ground
Lot
- Size: 0.28 Acres
- Dimensions: 109.71 x 109.71
- Features: Corner Lot
Details
- Parcel number: 126840000000
Construction
Type & style
- Home type: SingleFamily
- Property subtype: Single Family Residence, Residential
Materials
- Roof: Tile
Condition
- New construction: No
- Year built: 2007
Utilities & green energy
- Sewer: Public Sewer
- Water: Public
- Utilities for property: Cable Connected, Electricity Connected, Natural Gas Connected, Phone Connected, Sewer Connected, Water Connected
Community & HOA
HOA
- Has HOA: No
Location
- Region: Visalia
Financial & listing details
- Price per square foot: $203/sqft
- Tax assessed value: $358,493
- Date on market: 9/23/2026
- Electric utility on property: Yes
Estimated market value
Not available
Estimated sales range
Not available
$2,930/mo
Price history
| Date | Event | Price |
|---|---|---|
| 9/23/2026 | Listed for sale | $540,000+89.5%$203/sqft |
Source:  TCMLS #244261 Report a problem | ||
| 1/19/2018 | Sold | $285,000+17.8%$107/sqft |
Source: TCMLS #133462 Report a problem | ||
| 9/20/2017 | Sold | $242,000-16.5%$91/sqft |
Source: Public Record Report a problem | ||
| 8/4/2017 | Price change | $289,900-1.7%$109/sqft |
Source: Bloom Group, Inc. #129605 Report a problem | ||
| 6/12/2017 | Price change | $295,000-1.6%$111/sqft |
Source: Bloom Group, Inc. #129605 Report a problem | ||
| 5/19/2017 | Price change | $299,900-1.7%$113/sqft |
Source: Bloom Group, Inc. #129605 Report a problem | ||
| 5/3/2017 | Price change | $305,000-1.6%$114/sqft |
Source: Bloom Group, Inc. #129605 Report a problem | ||
| 4/21/2017 | Price change | $310,000-1.6%$116/sqft |
Source: Bloom Group, Inc. #129605 Report a problem | ||
| 4/15/2017 | Listed for sale | $315,000$118/sqft |
Source: Bloom Group, Inc. #129605 Report a problem | ||
| 6/22/2007 | Sold | $315,000$118/sqft |
Source: Public Record Report a problem | ||
Public tax history
| Year | Property taxes | Tax assessment |
|---|---|---|
| 2026 | -- | $358,493 +2% |
| 2025 | $4,965 +9.2% | $351,465 +2% |
| 2024 | $4,548 +7.5% | $344,575 +2% |
| 2023 | $4,231 +12.9% | $337,819 +2% |
| 2022 | $3,748 +3% | $331,196 +3.6% |
| 2021 | $3,639 +7.2% | $319,793 +7.9% |
| 2020 | $3,393 +3.1% | $296,514 +2% |
| 2019 | $3,293 +19.7% | $290,700 +20.1% |
| 2018 | $2,750 -21.3% | $242,000 -22.6% |
| 2017 | $3,493 +4.6% | $312,652 +4.7% |
| 2016 | $3,340 | $298,593 +3.5% |
| 2015 | $3,340 +17.2% | $288,510 +13.7% |
| 2014 | $2,850 | $253,790 +25% |
| 2013 | -- | $203,000 +1.5% |
| 2012 | -- | $200,000 -8.7% |
| 2011 | -- | $219,000 |
Find assessor info on the county website
Monthly payment
Est. payment
Payment breakdown
Explore the cost of this home by adjusting the details. Changes won't be saved.Climate risks
Neighborhood: Park Place
Similar homes
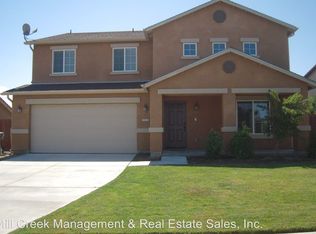
- $460,0005 bd3 ba2.3k sqft2631 E Parkview Avenue, Visalia, CA 93292For Sale
 MLS ID #244241, Cindy Cobian, Independent Broker Network. TCMLS
- $456,0004 bd3 ba2.3k sqft2516 Cherry Avenue, Visalia, CA 93292For Sale
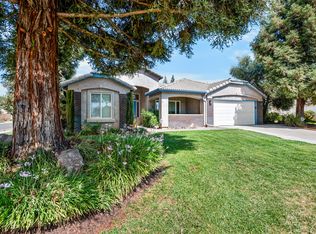 MLS ID #244317, Jillian E Bos, Independent Broker Network. TCMLS
- $449,0003 bd3 ba2.5k sqft2440 E Howard Avenue E, Visalia, CA 93292For Sale
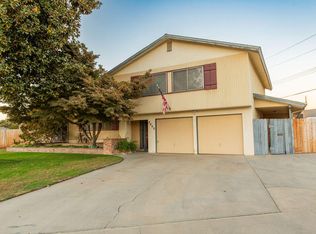 MLS ID #244713, Cynthia Kennemer, Berkshire Hathaway HomeServices California Realty. TCMLS
- $--5 bd5 ba2.9k sqft2250 S Leah Ct, Visalia, CA 93292Auction
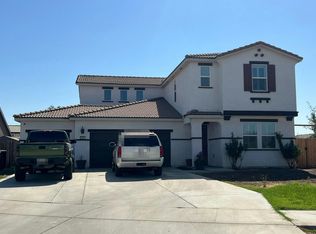 Auction.com 2
