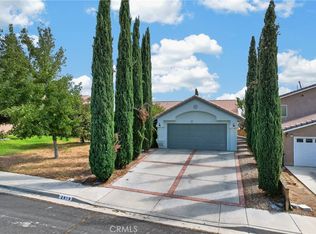
Welcome home to this beautifully maintained property, ideally situated on a desirable cul-de-sac! This inviting home offers a wonderful combination of comfort, charm, and functionality. Inside, you'll find a welcoming layout with comfortable living spaces perfect for everyday living and gathering with family and friends. Step outside to enjoy the backyard, featuring an extended covered patio that provides the perfect space for entertaining, outdoor dining, or simply relaxing. The backyard also includes a putting green, adding a fun touch for golf enthusiasts and those looking to enjoy some recreation at home. With its well-maintained condition, desirable cul-de-sac location, and inviting indoor and outdoor spaces, this home is one you won't want to miss!
For sale
$397,750
3343 Marlene Ct, Rosamond, CA 93560
3beds
1,329sqft
Single Family Residence
Built in 1991
6,969 Square Feet Lot
$399,100 Zestimate®
$299/sqft
$-- HOA
What's special
Welcoming layoutComfortable living spacesOutdoor diningExtended covered patioDesirable cul-de-sac
- 2 days
- 221
- 28
Likely to sell faster than
Zillow last checked:
Listing updated:
Listed by:
Nikki Rodio DRE #02091895 661-400-8511,
RE/MAX All-Pro
Source: GAVAR,MLS#: 26008348
Facts & features
Interior
Bedrooms & bathrooms
- Bedrooms: 3
- Bathrooms: 2
- Full bathrooms: 2
Heating
- Has Heating (Unspecified Type)
Cooling
- Has cooling: Yes
Appliances
- Included: Dishwasher, Gas Range, Microwave, None
Features
- Has fireplace: Yes
- Fireplace features: Family Room
Interior area
- Total structure area: 1,329
- Total interior livable area: 1,329 sqft
Property
Parking
- Total spaces: 2
- Parking features: Garage
- Garage spaces: 2
Features
- Stories: 1
- Pool features: None
- Fencing: Block
Lot
- Size: 6,969 Square Feet
Details
- Parcel number: 47220108000
- Zoning: R-1 Fps
Construction
Type & style
- Home type: SingleFamily
- Architectural style: Traditional
- Property subtype: Single Family Residence
Materials
- Stucco
- Foundation: Slab
- Roof: Tile
Condition
- Year built: 1991
Utilities & green energy
- Water: Public
- Utilities for property: Natural Gas Available, Sewer Connected
Community & HOA
Location
- Region: Rosamond
Financial & listing details
- Price per square foot: $299/sqft
- Tax assessed value: $386,425
- Date on market: 11/5/2026
- Listing agreement: Exclusive Right To Sell
- Listing terms: VA Loan,Conventional,FHA
Estimated market value
$399,100
$379,000 - $419,000
$2,370/mo
Price history
| Date | Event | Price |
|---|---|---|
| 11/5/2026 | Listed for sale | $397,750+13.6%$299/sqft |
Source:  GAVAR #26008348 Report a problem | ||
| 5/18/2021 | Sold | $350,000+3%$263/sqft |
Source: GAVAR #21002260 Report a problem | ||
| 3/18/2021 | Pending sale | $339,900+23.6%$256/sqft |
Source: GAVAR #21002260 Report a problem | ||
| 6/4/2020 | Sold | $274,900$207/sqft |
Source: GAVAR #20003184 Report a problem | ||
| 4/27/2020 | Pending sale | $274,900$207/sqft |
Source: Coldwell Banker A Hartwig Company #20003184 Report a problem | ||
| 4/22/2020 | Listed for sale | $274,900+14.5%$207/sqft |
Source: Coldwell Banker-A Hartwig Co. #20003184 Report a problem | ||
| 3/2/2018 | Sold | $240,000+2.1%$181/sqft |
Source: GAVAR #18000911 Report a problem | ||
| 1/30/2018 | Pending sale | $235,000$177/sqft |
Source: Berkshire Hathaway HomeServices Troth, REALTORS #18000911 Report a problem | ||
| 1/25/2018 | Listed for sale | $235,000+5.6%$177/sqft |
Source: Berkshire Hathaway HomeServices Troth, REALTORS #18000911 Report a problem | ||
| 11/15/2007 | Sold | $222,500+18.4%$167/sqft |
Source: Public Record Report a problem | ||
| 6/22/2004 | Sold | $188,000$141/sqft |
Source: Public Record Report a problem | ||
Public tax history
| Year | Property taxes | Tax assessment |
|---|---|---|
| 2026 | -- | $386,425 +2% |
| 2025 | $6,331 +7% | $378,849 +2% |
| 2024 | $5,915 +2.3% | $371,422 +2% |
| 2023 | $5,781 +3.3% | $364,140 +2% |
| 2022 | $5,597 | $357,000 +28.5% |
| 2021 | -- | $277,848 +11.3% |
| 2020 | $4,190 +27.2% | $249,696 |
| 2019 | $3,293 +40.2% | $249,696 +39.5% |
| 2018 | $2,349 -0.1% | $179,000 |
| 2017 | $2,352 +22.3% | $179,000 +20.1% |
| 2016 | $1,923 +19.2% | $149,000 +18.3% |
| 2015 | $1,614 -18.1% | $126,000 |
| 2014 | $1,970 | $126,000 +27.3% |
| 2013 | -- | $99,000 -11.6% |
| 2012 | $1,370 +8.6% | $111,989 +7.7% |
| 2011 | $1,261 -2.7% | $103,990 -2.3% |
| 2010 | $1,296 -9.2% | $106,442 -12% |
| 2009 | $1,428 -40.9% | $121,000 -42.7% |
| 2008 | $2,416 +3.4% | $211,000 +5.8% |
| 2007 | $2,337 +0.4% | $199,506 +2% |
| 2006 | $2,329 +3% | $195,595 +2% |
| 2005 | $2,261 +257.1% | $191,760 +233.9% |
| 2004 | $633 -7.7% | $57,434 +1.9% |
| 2003 | $686 | $56,382 +4% |
| 2002 | $686 +0.8% | $54,195 +2% |
| 2001 | $680 | $53,133 |
| 2000 | -- | $53,133 |
Find assessor info on the county website
Monthly payment
Est. payment
Payment breakdown
Explore the cost of this home by adjusting the details. Changes won't be saved.Climate risks
Neighborhood: 93560


Similar homes
- $389,0004 bd2 ba1.5k sqft3112 Myrtle Ave, Rosamond, CA 93560For Sale
 MLS ID #26006664, Jennifer Cordtz. GAVAR
- $385,9003 bd2 ba1.2k sqft3448 W Roxbury St, Rosamond, CA 93560For Sale
 MLS ID #26005727, Juan Fernandez. GAVAR
- $380,0003 bd2 ba1.6k sqft2816 Owens Way, Rosamond, CA 93560For Sale
 MLS ID #SR26196551, Sabrina Villa, Forward Rlty. CRMLS
- $369,7773 bd2 ba1k sqft1325 Bradford Ave, Rosamond, CA 93560For Sale
 MLS ID #26005572, Roy A Shaver. GAVAR
