WOW amazing Rosamond home Located on the end of a cul-de-sac street, this home Features 4 bedrooms with 3 baths, an open layout with high ceilings and large kitchen with island, HUGE master and suite, NEWER HVAC system, NEW two-tone paint, NEW fixtures, Long driveway, LARGE lot with brick fencing and more. Come see this house before it's gone, at this price, it surely won't last!
For sale
Price cut: $15K (10/2)
$399,990
1000 Cloverdale Ct, Rosamond, CA 93560
4beds
1,705sqft
Single Family Residence
Built in 1990
10,018 Square Feet Lot
$399,900 Zestimate®
$235/sqft
$-- HOA
What's special
- 65 days
- 624
- 70
Zillow last checked:
Listing updated:
Listed by:
Kenan Shahla DRE #01855080 661-433-1669,
Pantheon Realty Corp.
Source: GAVAR,MLS#: 26006432
Facts & features
Interior
Bedrooms & bathrooms
- Bedrooms: 4
- Bathrooms: 3
- Full bathrooms: 2
- 1/2 bathrooms: 1
Cooling
- Has cooling: Yes
Appliances
- Included: Dishwasher, Disposal, Gas Oven, Gas Range, None
Features
- Has fireplace: Yes
- Fireplace features: Family Room
Interior area
- Total structure area: 1,705
- Total interior livable area: 1,705 sqft
Property
Parking
- Total spaces: 2
- Parking features: Garage
- Garage spaces: 2
Features
- Stories: 2
- Pool features: None
Lot
- Size: 10,018 Square Feet
Details
- Parcel number: 25143212004
- Zoning: R-1
Construction
Type & style
- Home type: SingleFamily
- Architectural style: Traditional
- Property subtype: Single Family Residence
Materials
- Stucco, Wood Siding
- Foundation: Slab
- Roof: Tile
Condition
- Year built: 1990
Utilities & green energy
- Water: Public
- Utilities for property: Natural Gas Available, Sewer Connected
Community & HOA
Location
- Region: Rosamond
Financial & listing details
- Price per square foot: $235/sqft
- Tax assessed value: $227,477
- Date on market: 8/16/2026
- Listing agreement: Exclusive Right To Sell
- Listing terms: VA Loan,Cash,Conventional
Estimated market value
$399,900
$380,000 - $420,000
$2,845/mo
Price history
| Date | Event | Price |
|---|---|---|
| 10/2/2026 | Price change | $399,990-3.6%$235/sqft |
Source:  GAVAR #26006432 Report a problem | ||
| 8/16/2026 | Listed for sale | $414,990+43.1%$243/sqft |
Source: GAVAR #26006432 Report a problem | ||
| 7/22/2026 | Sold | $290,000+220.4%$170/sqft |
Source: Public Record Report a problem | ||
| 4/26/1999 | Sold | $90,500+16.3%$53/sqft |
Source: Public Record Report a problem | ||
| 1/13/1998 | Sold | $77,814$46/sqft |
Source: Public Record Report a problem | ||
Public tax history
| Year | Property taxes | Tax assessment |
|---|---|---|
| 2026 | -- | $227,477 +2% |
| 2025 | $4,541 +6.9% | $223,018 +2% |
| 2024 | $4,247 +3.1% | $218,646 +2% |
| 2023 | $4,120 +3.8% | $214,360 +2% |
| 2022 | $3,968 | $210,158 +2% |
| 2021 | -- | $206,039 +1% |
| 2020 | $3,725 +31.7% | $203,928 |
| 2019 | $2,829 +2.7% | $203,928 +4% |
| 2018 | $2,754 +1.7% | $196,011 +2% |
| 2017 | $2,710 +4.4% | $192,169 +2% |
| 2016 | $2,595 +25.4% | $188,402 +27.3% |
| 2015 | $2,069 -15.7% | $148,000 -3.3% |
| 2014 | $2,454 | $153,000 +15.9% |
| 2013 | -- | $132,000 +13.3% |
| 2012 | $1,587 +0.1% | $116,538 -1% |
| 2011 | $1,587 -14.3% | $117,699 -15.1% |
| 2010 | $1,852 -16.1% | $138,606 -20% |
| 2009 | $2,208 +3.9% | $173,197 +2% |
| 2008 | $2,124 +3% | $169,802 +2% |
| 2007 | $2,063 +0.6% | $166,473 +2% |
| 2006 | $2,050 +3.2% | $163,210 +2% |
| 2005 | $1,986 +3.6% | $160,011 |
| 2004 | $1,917 +13.8% | $160,011 +1.9% |
| 2003 | $1,685 +52% | $157,080 +64.5% |
| 2002 | $1,108 +0.3% | $95,508 +2% |
| 2001 | $1,105 | $93,636 |
| 2000 | -- | $93,636 |
Find assessor info on the county website
Monthly payment
Est. payment
Payment breakdown
Explore the cost of this home by adjusting the details. Changes won't be saved.Climate risks
Neighborhood: 93560
Similar homes
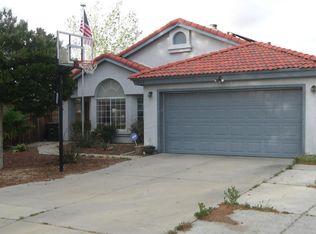
- $429,9004 bd3 ba1.8k sqft1009 Heatherfield Ave, Rosamond, CA 93560For Sale
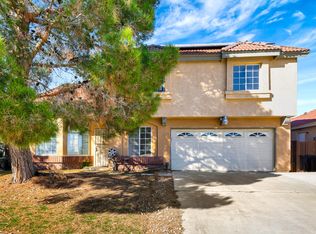 MLS ID #26005676, Christie M Limpus. GAVAR
- $424,9004 bd2 ba1.6k sqft3301 Toby St, Rosamond, CA 93560For Sale
 MLS ID #26007328, Guadalupe C Wrona. GAVAR
- $399,9504 bd2 ba1.5k sqft2050 Matthew Ave, Rosamond, CA 93560For Sale
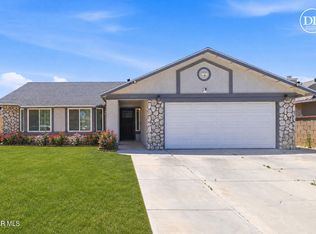 MLS ID #26004617, Jennifer Anderson. GAVAR
- $389,0004 bd2 ba1.5k sqft3112 Myrtle Ave, Rosamond, CA 93560For Sale
 MLS ID #26006664, Jennifer Cordtz. GAVAR
