Excellent opportunity for a first time homebuyer or investor. Close to shopping, 15 minutes to beaches
For sale
$215,000
35 47th Ave, Vero Beach, FL 32968
2beds
1,175sqft
Single Family Residence
Built in 1983
4,791 Square Feet Lot
$-- Zestimate®
$183/sqft
$-- HOA
What's special
- 14 days
- 277
- 28
Likely to sell faster than
Zillow last checked:
Listing updated:
Listed by:
Bill Carroll 772-316-0700,
Classic Homes of Treas Coast
Source: Realtor Association of Indian River County,MLS#: 301004 Originating MLS: Indian River
Facts & features
Interior
Bedrooms & bathrooms
- Bedrooms: 2
- Bathrooms: 2
- Full bathrooms: 2
Bedroom
- Dimensions: 11x11
Bedroom
- Dimensions: 11x11
Kitchen
- Dimensions: 13x9
Living room
- Dimensions: 18x16
Heating
- Central
Cooling
- Central Air
Appliances
- Included: Range, Refrigerator
- Laundry: None
Features
- Flooring: Tile
- Windows: None, Single Hung
- Has fireplace: No
Interior area
- Total interior livable area: 1,175 sqft
Property
Parking
- Parking features: Driveway
- Has uncovered spaces: Yes
Features
- Levels: One
- Stories: 1
- Exterior features: None
- Pool features: None
- Has view: Yes
- View description: Other
- Waterfront features: None
Lot
- Size: 4,791 Square Feet
- Dimensions: .11
- Features: < 1/4 Acre
Details
- Parcel number: 33391600002000600013.0
- Zoning: ,
- Zoning description: Residential
Construction
Type & style
- Home type: SingleFamily
- Architectural style: One Story
- Property subtype: Single Family Residence
Materials
- Frame
- Roof: Metal
Condition
- New construction: No
- Year built: 1983
Utilities & green energy
- Sewer: Septic Tank
- Water: Public
Community & HOA
Community
- Features: None, Other
- Subdivision: Stevens Park
HOA
- HOA name: NONE
Location
- Region: Vero Beach
Financial & listing details
- Price per square foot: $183/sqft
- Tax assessed value: $150,980
- Annual tax amount: $2,656
- Date on market: 11/1/2026
- Listing terms: Cash,FHA,New Loan,VA Loan
- Ownership: Single Family/Other
Estimated market value
Not available
Estimated sales range
Not available
Not available
Price history
| Date | Event | Price |
|---|---|---|
| 11/2/2026 | Listed for sale | $215,000+347.9%$183/sqft |
Source:  Realtor Association of Indian River County #301004 Report a problem | ||
| 3/5/2020 | Listing removed | $1,295$1/sqft |
Source: Zillow Rental Manager Report a problem | ||
| 2/20/2020 | Listed for rent | $1,295+3.6%$1/sqft |
Source: Zillow Rental Manager Report a problem | ||
| 11/21/2018 | Listing removed | $1,250$1/sqft |
Source: Zillow Rental Manager Report a problem | ||
| 11/13/2018 | Listed for rent | $1,250$1/sqft |
Source: Zillow Rental Manager Report a problem | ||
| 10/8/2018 | Listing removed | $1,250$1/sqft |
Source: Zillow Rental Manager Report a problem | ||
| 9/7/2018 | Listed for rent | $1,250$1/sqft |
Source: Zillow Rental Manager Report a problem | ||
| 5/22/2013 | Sold | $48,000+1.5%$41/sqft |
Source: Agent Provided Report a problem | ||
| 3/23/2013 | Listed for sale | $47,300-7.8%$40/sqft |
Source: Homepath Report a problem | ||
| 7/2/2011 | Listing removed | $51,300$44/sqft |
Source: RE/MAX CROWN REALTY #115721 Report a problem | ||
| 2/26/2011 | Listed for sale | $51,300-66.9%$44/sqft |
Source: RE/MAX Crown Realty #115721 Report a problem | ||
| 9/8/2005 | Sold | $155,000$132/sqft |
Source: Public Record Report a problem | ||
Public tax history
| Year | Property taxes | Tax assessment |
|---|---|---|
| 2025 | $2,656 +13.7% | $150,980 -13.8% |
| 2024 | $2,337 +7.5% | $175,215 +3.4% |
| 2023 | $2,173 +11.3% | $169,396 +16.3% |
| 2022 | $1,953 +13.3% | $145,668 +27.5% |
| 2021 | $1,724 +7.5% | $114,227 +8.4% |
| 2020 | $1,603 | $105,406 +18.5% |
| 2019 | $1,603 +9.7% | $88,948 +14.1% |
| 2018 | $1,462 +17% | $77,944 +7.1% |
| 2017 | $1,249 | $72,752 +4.1% |
| 2016 | $1,249 +5.8% | $69,870 +20% |
| 2015 | $1,180 +8.8% | $58,210 +8.3% |
| 2014 | $1,085 | $53,730 +9.2% |
| 2013 | -- | $49,210 -1% |
| 2012 | $484 -11.5% | $49,730 -13% |
| 2011 | $547 -1.8% | $57,190 -2.4% |
| 2010 | $557 -12.3% | $58,620 -18.3% |
| 2009 | $635 -23.5% | $71,790 -19.1% |
| 2008 | $830 -33.2% | $88,750 -12.4% |
| 2007 | $1,243 | $101,270 -4.7% |
| 2006 | -- | $106,260 +72.1% |
| 2005 | -- | $61,760 |
| 2004 | -- | $61,760 +4.8% |
| 2003 | -- | $58,950 +7% |
| 2002 | $523 +2.3% | $55,090 +3.2% |
| 2001 | $511 +2.4% | $53,400 +13.1% |
| 2000 | $500 | $47,210 |
Find assessor info on the county website
Monthly payment
Est. payment
Payment breakdown
Explore the cost of this home by adjusting the details. Changes won't be saved.Climate risks
Neighborhood: Vero Beach South

Similar homes
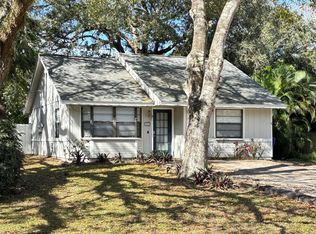
- $280,0002 bd2 ba1k sqft4360 1ST Street, Vero Beach, FL 32968For Sale
 MLS ID #B26098727, Ursula Zahn, Keller Williams Realty of Vero. BeachesMLS
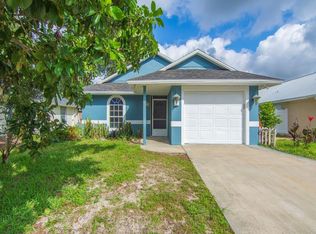
- $239,0002 bd2 ba1.1k sqft1326 25th Ave SW, Vero Beach, FL 32962For Sale
 MLS ID #301328, Hamilton Harris, Alex MacWilliam, Inc.. Realtor Association of Indian River County
- $199,9003 bd2 ba1.3k sqft2936 1st St SW, Vero Beach, FL 32968For Sale
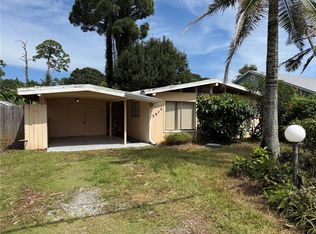 MLS ID #300296, Jonathan D Sternberg, One Sotheby's Int'l Realty. Realtor Association of Indian River County
- $215,0003 bd2 ba1.2k sqft1305 26th Avenue SW, Vero Beach, FL 32962For Sale
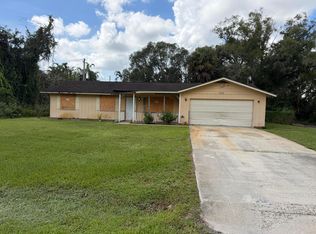 MLS ID #B26087643, Al Benkert, Vero Beachside Sales Rentals. BeachesMLS
- $214,9003 bd2 ba1.4k sqft1520 39TH Avenue, Vero Beach, FL 32960For SaleMLS ID #B26082327, Phyllis W Horner, Tropic Shores Real Estate LLC. BeachesMLS
- $215,0002 bd2 ba1.4k sqft2020 Vero South Circle SW #4, Vero Beach, FL 32962For SaleMLS ID #B26084483, Anthony D Vlahovic, Engel & Voelkers Vero Beach. BeachesMLS
- $284,9002 bd1 ba778 sqft2270 4TH Lane, Vero Beach, FL 32962For SaleMLS ID #B26098704, Brian P Hamwey, LPT Realty, LLC. BeachesMLS
- $231,5002 bd2 ba1.1k sqft1443 39th Avenue #2, Vero Beach, FL 32960For SaleMLS ID #R11163751, Debra Madden, Hutchinson Island Realty, LLC. BeachesMLS
