This is a 1003 square foot, 1.5 bathroom, single family home. This home is located at 3547 Morley Dr, New Port Richey, FL 34652.
Pre-foreclosure
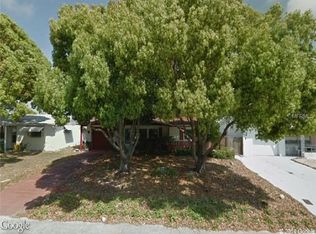
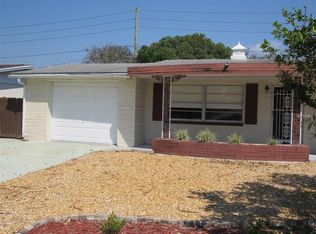
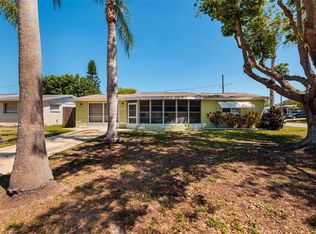
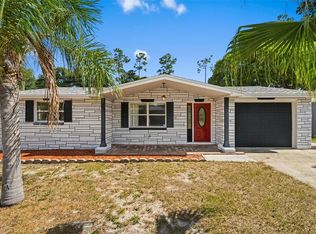
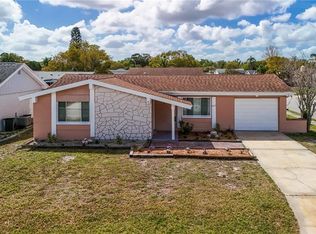
Street View
Est. $231,800
3547 Morley Dr, New Port Richey, FL 34652
--beds
1baths
1,003sqft
SingleFamily
Built in 1971
5,967 Square Feet Lot
$231,800 Zestimate®
$231/sqft
$-- HOA
Overview
- 128 days |
- 14 |
- 0 |
Facts & features
Interior
Bedrooms & bathrooms
- Bathrooms: 1.5
Heating
- Forced air
Cooling
- Central
Features
- Flooring: Other
Interior area
- Total interior livable area: 1,003 sqft
Property
Parking
- Parking features: Garage - Attached
Features
- Exterior features: Stucco
Lot
- Size: 5,967 Square Feet
Details
- Parcel number: 2026160620000005450
Construction
Type & style
- Home type: SingleFamily
Materials
- Concrete Block
- Roof: Asphalt
Condition
- Year built: 1971
Community & HOA
Location
- Region: New Port Richey
Financial & listing details
- Price per square foot: $231/sqft
- Tax assessed value: $186,906
- Annual tax amount: $3,397
Visit our professional directory to find a foreclosure specialist in your area that can help with your home search.
Find a foreclosure agentForeclosure details
Estimated market value
$231,800
$213,000 - $250,000
$1,624/mo
Price history
| Date | Event | Price |
|---|---|---|
| 12/16/2025 | Listing removed | $220,000$219/sqft |
Source: | ||
| 7/17/2025 | Price change | $220,000-2.2%$219/sqft |
Source: | ||
| 6/12/2025 | Listed for sale | $225,000+40.6%$224/sqft |
Source: | ||
| 6/2/2023 | Sold | $160,000$160/sqft |
Source: Public Record Report a problem | ||
Public tax history
| Year | Property taxes | Tax assessment |
|---|---|---|
| 2024 | $3,397 +19.3% | $186,906 +7.4% |
| 2023 | $2,848 +26.5% | $174,026 +36% |
| 2022 | $2,251 +256% | $127,985 +135.8% |
| 2021 | $632 +0.5% | $54,270 +1.4% |
| 2020 | $629 -56.9% | $53,527 -24.8% |
| 2019 | $1,457 | $71,180 -5.8% |
| 2018 | $1,457 +11.2% | $75,599 +18.5% |
| 2017 | $1,311 +9.4% | $63,794 +14.8% |
| 2016 | $1,199 +21.6% | $55,562 +14.3% |
| 2015 | $986 +10.4% | $48,617 +9.2% |
| 2014 | $892 | $44,507 -0.3% |
| 2013 | -- | $44,638 -5.3% |
| 2012 | -- | $47,147 -17.9% |
| 2011 | -- | $57,451 -5.2% |
| 2010 | -- | $60,618 -11.3% |
| 2009 | -- | $68,311 -25.6% |
| 2008 | -- | $91,839 -19.3% |
| 2007 | -- | $113,769 +2.5% |
| 2006 | -- | $110,965 +37.6% |
| 2005 | -- | $80,617 +16.5% |
| 2004 | -- | $69,207 +14.4% |
| 2003 | -- | $60,484 +11.3% |
| 2002 | -- | $54,322 +21.1% |
| 2000 | -- | $44,862 +1.8% |
| 1999 | -- | $44,072 |
Find assessor info on the county website
Monthly payment
Estimated monthly payment$1,822
All calculations are estimates and provided by Zillow, Inc. for informational purposes only. Actual amounts may vary.
HOA fees may include property taxes on listings classified as Co-Ops. Contact the listing agent and/or owner for fee details.
Mortgage interest rates are dependent on a number of factors, including credit score, down payment, and repayment length. Interest rate data provided by Zillow Group Marketplace, Inc. as of 1/1/1970 from various mortgage lenders with which we have lead or other similar arrangements; the Estimated Payment is an average of those rates.
See how much you could borrow to make a competitive offer.
Climate risks
Neighborhood: 34652
Nearby schools
GreatSchools rating
- 1/10Anclote Elementary SchoolGrades: PK-5Distance: 0.8 mi
- 2/10Gulf Middle SchoolGrades: 6-8Distance: 2.6 mi
- 3/10Gulf High SchoolGrades: 9-12Distance: 1.7 mi


- Florida
- Pasco County
- New Port Richey
- 34652
- 3547 Morley Dr
Nearby cities
Nearby neighborhoods
Nearby zip codes
Other New Port Richey Topics
