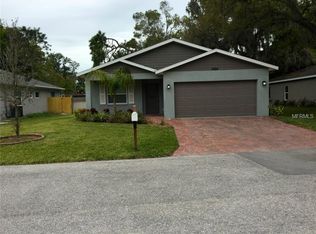
Newer Ranch on quiet dead end street. No HOA fees or restrictions.
This property is off market, which means it's not currently listed for sale or rent on Zillow. This may be different from what's available on other websites or public sources.
$409,700
$389,000 - $430,000
$2,650/mo
$2,650/mo
Rent Zestimate®
Find your next renter with Zillow Rental Manager. Plus, with online applications, you can quickly screen prospective tenants – for free.
$2,650/mo
Rent Zestimate®
$2,612/mo
Est. payment
Refinancing to a lower rate could help reduce your monthly payments and save thousands over the life of the loan.
$2,612/mo
Est. payment
Work with a Zillow partner agent
Leverage their expertise and Zillow's premium Showcase listings to get your home seen by more buyers.
Get startedList with your own agent
Get your home in front of millions of buyers by listing it on Zillow.
Learn how to do itSell it yourself
Take full control of how buyers see your home on Zillow by listing For Sale by Owner (FSBO).
List your homeNewer Ranch on quiet dead end street. No HOA fees or restrictions.
This property is off market, which means it's not currently listed for sale or rent on Zillow. This may be different from what's available on other websites or public sources.
| Date | Event | Price |
|---|---|---|
| 3/15/2022 | Sold | $460,000-4.1%$285/sqft |
Source: Public Record Report a problem | ||
| 2/3/2022 | Pending sale | $479,900$298/sqft |
Source: | ||
| 1/27/2022 | Listed for sale | $479,900+11.6%$298/sqft |
Source: | ||
| 6/27/2021 | Listing removed | -- |
Source: Owner Report a problem | ||
| 5/19/2021 | Listed for sale | $429,900+64.1%$267/sqft |
Source: Owner Report a problem | ||
| 8/3/2015 | Sold | $262,000-2.9%$163/sqft |
Source: Public Record Report a problem | ||
| 4/10/2015 | Listing removed | $269,900$167/sqft |
Source: SARASOTA REALTY ASSOC., INC. #N5902777 Report a problem | ||
| 3/26/2015 | Price change | $269,900-3.6%$167/sqft |
Source: SARASOTA REALTY ASSOC., INC. #N5902777 Report a problem | ||
| 2/12/2015 | Price change | $279,900+1.8%$174/sqft |
Source: SARASOTA REALTY ASSOC., INC. #N5902777 Report a problem | ||
| 12/17/2014 | Listed for sale | $274,9000%$171/sqft |
Source: Exit King Realty #A4109654 Report a problem | ||
| 11/15/2014 | Listing removed | $275,000$171/sqft |
Source: SARASOTA REALTY ASSOC., INC. (284509222) #N5784829 Report a problem | ||
| 8/22/2014 | Price change | $275,000+2.2%$171/sqft |
Source: SARASOTA REALTY ASSOC., INC. (284509222) #N5784829 Report a problem | ||
| 6/8/2014 | Listed for sale | $269,000-8.8%$167/sqft |
Source: SARASOTA REALTY ASSOC., INC. #N5784829 Report a problem | ||
| 7/20/2013 | Listing removed | $295,000$183/sqft |
Source: Impulse Realty LLC #A3976033 Report a problem | ||
| 4/13/2013 | Price change | $295,000+7.3%$183/sqft |
Source: Impulse Realty LLC #A3976033 Report a problem | ||
| 4/4/2013 | Listed for sale | $275,000+733.3%$171/sqft |
Source: Impulse Realty LLC #A3976033 Report a problem | ||
| 7/24/2012 | Sold | $33,000-5.7%$20/sqft |
Source: Public Record Report a problem | ||
| 5/27/2012 | Listed for sale | $35,000-30%$22/sqft |
Source: MARKET AMERICA REALTY & INVEST #A3960954 Report a problem | ||
| 10/13/2011 | Sold | $50,000+51.5%$31/sqft |
Source: Agent Provided Report a problem | ||
| 9/17/2011 | Price change | $33,000-13.2%$20/sqft |
Source: CLEAR VISION REALTY #M5823308 Report a problem | ||
| 8/13/2011 | Listed for sale | $38,000+123.5%$24/sqft |
Source: CLEAR VISION REALTY #M5823308 Report a problem | ||
| 2/26/2010 | Sold | $17,000$11/sqft |
Source: Public Record Report a problem | ||
| Year | Property taxes | Tax assessment |
|---|---|---|
| 2025 | $3,814 +3.6% | $313,104 +2.9% |
| 2024 | $3,681 +4.2% | $304,280 +3% |
| 2023 | $3,534 -24.7% | $295,417 -17.8% |
| 2022 | $4,693 +109.7% | $359,500 +97.4% |
| 2021 | $2,238 +0.3% | $182,154 +1.4% |
| 2020 | $2,232 +4.3% | $179,639 +2.3% |
| 2019 | $2,141 | $175,600 +1.9% |
| 2018 | $2,141 +3.1% | $172,326 +2.1% |
| 2017 | $2,077 -17.8% | $168,782 -16.6% |
| 2016 | $2,526 | $202,400 +12.4% |
| 2015 | $2,526 | $180,100 +1205.1% |
| 2014 | $2,526 +1044.4% | $13,800 |
| 2013 | $221 +4.1% | $13,800 +3.8% |
| 2012 | $212 -2.8% | $13,300 -5% |
| 2011 | $218 -22% | $14,000 -20.9% |
| 2010 | $280 -59.8% | $17,700 -60.7% |
| 2009 | $696 | $45,000 -12.5% |
| 2008 | $696 -19.9% | $51,400 -20.7% |
| 2007 | $870 | $64,800 |
Find assessor info on the county website
Source: The MLS. This data may not be complete. We recommend contacting the local school district to confirm school assignments for this home.