Great unit in a great location with manicure grounds near shopping
2+2 Unit newly renovated ready for move in a must see to appreciate .
For sale
$299,900
37940 42nd St E APT 111, Palmdale, CA 93552
2beds
880sqft
Condominium
Built in 1990
-- sqft lot
$299,400 Zestimate®
$341/sqft
$-- HOA
What's special
Newly renovated
- 6 days
- 111
- 5
Likely to sell faster than
Zillow last checked:
Listing updated:
Listed by:
Eva G Cruz DRE #01310929 661-209-0593,
HomeSmart AV
Source: GAVAR,MLS#: 26008300
Facts & features
Interior
Bedrooms & bathrooms
- Bedrooms: 2
- Bathrooms: 2
- Full bathrooms: 2
Cooling
- Has cooling: Yes
Appliances
- Included: Dishwasher, Gas Oven, Gas Range, None
Features
- Has fireplace: Yes
- Fireplace features: Gas, Living Room
Interior area
- Total structure area: 880
- Total interior livable area: 880 sqft
Property
Parking
- Total spaces: 2
- Parking features: Garage - Attached
- Attached garage spaces: 2
Features
- Stories: 1
- Has private pool: Yes
- Pool features: Fenced, Community, In Ground, Association
Lot
- Size: 6.23 Acres
Details
- Parcel number: 3023069007
- Zoning: Pdr3-R3dp
Construction
Type & style
- Home type: Condo
- Architectural style: Traditional
- Property subtype: Condominium
Materials
- Frame, Stucco, Wood Siding
- Foundation: Slab
- Roof: Shingle,Tile
Condition
- Year built: 1990
Utilities & green energy
- Water: Public
- Utilities for property: Natural Gas Available, Sewer Connected
Community & HOA
HOA
- Has HOA: Yes
- Services included: Recreation Building, Maintenance Structure, Pool
Location
- Region: Palmdale
Financial & listing details
- Price per square foot: $341/sqft
- Tax assessed value: $253,935
- Date on market: 11/2/2026
- Listing agreement: Exclusive Right To Sell
- Listing terms: Cash,Conventional,FHA
- Road surface type: Paved
Estimated market value
$299,400
$284,000 - $314,000
$2,173/mo
Price history
| Date | Event | Price |
|---|---|---|
| 11/3/2026 | Listed for sale | $299,900+30.4%$341/sqft |
Source:  GAVAR #26008300 Report a problem | ||
| 3/31/2021 | Sold | $230,000+2.2%$261/sqft |
Source: GAVAR #21001011 Report a problem | ||
| 2/19/2021 | Pending sale | $225,000$256/sqft |
Source: GAVAR #21001011 Report a problem | ||
| 2/9/2021 | Listed for sale | $225,000+55.2%$256/sqft |
Source: GAVAR #21001011 Report a problem | ||
| 9/28/2017 | Sold | $145,000+7.4%$165/sqft |
Source: GAVAR #17007753 Report a problem | ||
| 8/28/2017 | Pending sale | $135,000$153/sqft |
Source: HomeBased Realty #17007753 Report a problem | ||
| 8/13/2017 | Listed for sale | $135,000+130.8%$153/sqft |
Source: HomeBased Realty #17007753 Report a problem | ||
| 2/13/1998 | Sold | $58,500-36%$66/sqft |
Source: Public Record Report a problem | ||
| 5/9/1997 | Sold | $91,400$104/sqft |
Source: Public Record Report a problem | ||
| 1/31/1997 | Sold | $91,400$104/sqft |
Source: Public Record Report a problem | ||
Public tax history
| Year | Property taxes | Tax assessment |
|---|---|---|
| 2026 | -- | $253,935 +2% |
| 2025 | $4,091 +5.5% | $248,956 +2% |
| 2024 | $3,877 +0.2% | $244,076 +2% |
| 2023 | $3,868 +4.2% | $239,291 +2% |
| 2022 | $3,711 +2.4% | $234,600 +53.9% |
| 2021 | $3,622 +38.5% | $152,419 +1% |
| 2020 | $2,615 | $150,857 +2% |
| 2019 | $2,615 +2.6% | $147,900 +2% |
| 2018 | $2,548 | $145,000 +81.8% |
| 2017 | $2,548 +44.1% | $79,777 +2% |
| 2016 | $1,768 +4.9% | $78,214 +1.5% |
| 2015 | $1,686 +1.8% | $77,040 +2% |
| 2014 | $1,657 | $75,532 +2.5% |
| 2012 | -- | $73,718 +2% |
| 2011 | -- | $72,274 +0.8% |
| 2010 | -- | $71,735 -0.2% |
| 2009 | -- | $71,907 +2% |
| 2008 | -- | $70,498 +2% |
| 2007 | -- | $69,117 +2% |
| 2006 | -- | $67,763 |
| 2005 | -- | $67,763 +4% |
| 2004 | -- | $65,133 +1.9% |
| 2003 | -- | $63,940 +2% |
| 2002 | -- | $62,687 +4% |
| 2000 | -- | $60,254 |
Find assessor info on the county website
Monthly payment
Est. payment
Payment breakdown
Explore the cost of this home by adjusting the details. Changes won't be saved.Climate risks
Neighborhood: 93552

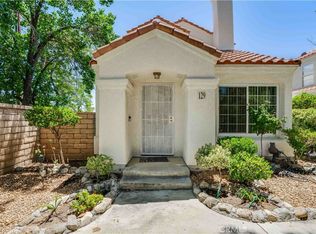
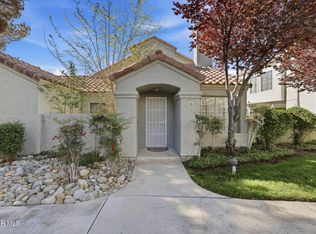
Similar homes
- $379,9993 bd3 ba1.3k sqft37940-123 42nd St E, Palmdale, CA 93552For Sale
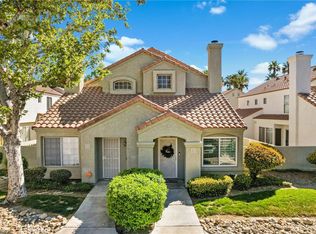 MLS ID #CV26065569, Alexia Chinchilla, THE GREAT REAL ESTATE COMPANY. CRMLS
- $290,0002 bd2 ba1k sqft122 Veteran Pl, Palmdale, CA 93550For Sale
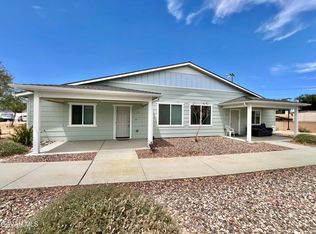 MLS ID #26006366, Marianne Llanos. GAVAR
- $275,0002 bd2 ba853 sqft2554 Olive Dr APT 19, Palmdale, CA 93550For Sale
 MLS ID #26004740, Jason P Bruce. GAVAR
- $275,0002 bd2 ba853 sqft2554 Olive Dr APT 10, Palmdale, CA 93550For Sale
 MLS ID #26004739, Jason P Bruce. GAVAR
