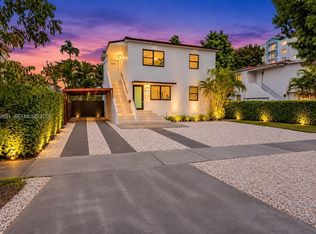
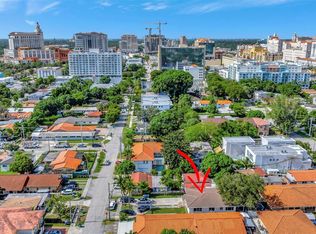
EXCELLENT INVESTMENT OPPORTUNITY – WELL-MAINTAINED DUPLEX IN A CONVENIENT LOCATION! Discover this fantastic investment opportunity featuring a duplex with two spacious units, each offering 2 bedrooms and 1 bathroom. Both units feature tile flooring throughout, central A/C, private laundry rooms equipped with washers and dryers, and rear porches. Additional highlights include a shingle roof, ample parking, and separate water and electric meters for each unit, providing added convenience and flexibility for investors. Conveniently located near shopping, dining, major roadways, and everyday essentials. An excellent opportunity to expand your investment portfolio!
For sale
$899,000
3828 SW 29th St, Miami, FL 33134
4beds
2baths
1,638sqft
Duplex
Built in 1954
-- sqft lot
$-- Zestimate®
$549/sqft
$-- HOA
What's special
Rear porchesAmple parkingShingle roofTile flooring throughout
- 18 days
- 591
- 40
Likely to sell faster than
Zillow last checked:
Listing updated:
Listed by:
Sama Chute 786-375-0028,
Chute Real Estate LLC
Source: MIAMI,MLS#: A12116594 Originating MLS: A-Miami Association of REALTORS
Facts & features
Interior
Bedrooms & bathrooms
- Bedrooms: 4
- Bathrooms: 2
Heating
- Central
Cooling
- Central Air
Features
- Flooring: Tile
Interior area
- Total structure area: 1,698
- Total interior livable area: 1,638 sqft
Video & virtual tour
Property
Parking
- Total spaces: 8
Features
- Stories: 1
Lot
- Features: Less Than 1/4 Acre Lot
Details
- Parcel number: 0141170031030
- Zoning: 5700
Construction
Type & style
- Home type: MultiFamily
- Property subtype: Duplex
Materials
- CBS Construction
- Roof: Shingle
Condition
- Year built: 1954
Utilities & green energy
- Sewer: Public Sewer
Community & HOA
Community
- Subdivision: Realty Securities Corppb
HOA
- Has HOA: No
Location
- Region: Miami
Financial & listing details
- Price per square foot: $549/sqft
- Tax assessed value: $678,484
- Annual tax amount: $14,321
- Date on market: 11/1/2026
- Listing terms: All Cash,Conventional
Estimated market value
Not available
Estimated sales range
Not available
Not available
Price history
| Date | Event | Price |
|---|---|---|
| 11/2/2026 | Listed for sale | $899,000+71.2%$549/sqft |
Source:  MIAMI #A12116594 Report a problem | ||
| 1/20/2020 | Listing removed | $525,000$321/sqft |
Source: LB Realty Partners, LLC. #A10658107 Report a problem | ||
| 11/20/2019 | Price change | $525,000-7.7%$321/sqft |
Source: LB Realty Partners, LLC. #A10658107 Report a problem | ||
| 11/11/2019 | Listed for sale | $569,000-5%$347/sqft |
Source: LB Realty Partners, LLC. #A10658107 Report a problem | ||
| 4/30/2019 | Listed for sale | $599,000+134.9%$366/sqft |
Source: LB Realty Partners, LLC. #A10658107 Report a problem | ||
| 2/4/2014 | Sold | $255,000-8.9%$156/sqft |
Source: Public Record Report a problem | ||
| 1/4/2014 | Price change | $279,900-9.7%$171/sqft |
Source: Homepath #A1886840 Report a problem | ||
| 12/3/2013 | Price change | $309,900-7.5%$189/sqft |
Source: Homepath #A1842255 Report a problem | ||
| 11/3/2013 | Price change | $334,900-5.6%$204/sqft |
Source: Homepath #A1842255 Report a problem | ||
| 9/14/2013 | Listed for sale | $354,9000%$217/sqft |
Source: Homepath #A1842255 Report a problem | ||
| 2/20/2008 | Sold | $355,000$217/sqft |
Source: Public Record Report a problem | ||
| 7/13/2007 | Sold | $355,000+111.3%$217/sqft |
Source: Public Record Report a problem | ||
| 1/10/2001 | Sold | $168,000+42.4%$103/sqft |
Source: Public Record Report a problem | ||
| 6/18/1997 | Sold | $118,000$72/sqft |
Source: Public Record Report a problem | ||
Public tax history
| Year | Property taxes | Tax assessment |
|---|---|---|
| 2025 | $14,321 +24.2% | $678,484 +48% |
| 2024 | $11,531 +13% | $458,432 +10.2% |
| 2023 | $10,207 +10.7% | $416,028 +10% |
| 2022 | $9,217 +14.3% | $378,208 +10% |
| 2021 | $8,065 +0.8% | $343,826 +1.7% |
| 2020 | $8,003 +5.5% | $338,223 +10% |
| 2019 | $7,583 +7.6% | $307,476 +10% |
| 2018 | $7,048 | $279,524 +10% |
| 2017 | $7,048 +14.7% | $254,113 |
| 2016 | $6,143 +0.7% | $254,113 +5.7% |
| 2015 | $6,103 +13.9% | $240,311 +18.5% |
| 2014 | $5,359 +4% | $202,803 +3.5% |
| 2013 | $5,155 | $195,902 +0.7% |
| 2012 | $5,155 -0.6% | $194,528 |
| 2011 | $5,185 -8.7% | $194,528 -4.2% |
| 2010 | $5,678 -10.9% | $203,154 -17.3% |
| 2009 | $6,375 -24.1% | $245,528 -29.8% |
| 2007 | $8,403 +18.8% | $349,938 |
| 2006 | $7,074 | -- |
| 2005 | $7,074 +11.2% | -- |
| 2004 | $6,362 +43.5% | -- |
| 2003 | $4,435 +44.7% | -- |
| 2002 | $3,064 | -- |
| 2001 | $3,064 | -- |
Find assessor info on the county website
Monthly payment
Est. payment
Payment breakdown
Explore the cost of this home by adjusting the details. Changes won't be saved.Climate risks
Neighborhood: Coral Way


Similar homes
- $1,249,0005 bd3 ba1.7k sqftGables Manor Sub, Miami, FL 33134For Sale
 MLS ID #A12119651, Ricky Kallabat PA, Keller Williams Capital Realty. MIAMI
- $920,0003 bd3 ba1.7k sqftAmnd Miami Suburban Acres, Miami, FL 33145For Sale
 MLS ID #A12122211, Gina Vignolo, Yaffe International Realty. MIAMI
- $940,0003 bd3 ba1.7k sqftAmd Plat Of Mia Suburban, Miami, FL 33145For Sale
 MLS ID #A12105491, Yolymiler Diaz Guillen, Guillen. MIAMI
- $879,0003 bd3 ba1.6k sqftGables Laroc, Coral Gables, FL 33134For Sale
 MLS ID #A12100570, Valaree Byrne, BHHS EWM Realty. MIAMI
- $999,0003 bd2 ba1.2k sqftSilver Bluff Gardens, Miami, FL 33133For SaleMLS ID #A11897423, Asdrubal Faneite, Xcellence. MIAMI
- $1,075,0004 bd5 ba1.9k sqftSilver Bluff Est Sec C, Miami, FL 33133For SaleMLS ID #A12112894, Daniel Burdak, Brickell Investment Realty. MIAMI
- $855,0003 bd3 ba1.4k sqftPomelo Park, Miami, FL 33133For SaleMLS ID #A12038835, Karen Gomez, Real Estate Sales Force. MIAMI
- $850,0003 bd2 ba1.2k sqftThe Pines, Miami, FL 33145For SaleMLS ID #A12114369, Sean Guim, Onyx Realty. MIAMI
- $865,0003 bd2 ba1.5k sqftDavis Citrus Farms, Miami, FL 33145For SaleMLS ID #A12054368, Rosemary Cortes, The Cortes Group Real Estate Inc.. MIAMI
- $715,0004 bd2 ba1.5k sqftSilver Bluff Gardens, Miami, FL 33133For SaleMLS ID #A12005015, Sama Chute, Chute Real Estate LLC. MIAMI
- $998,0005 bd3 ba2.3k sqftThe Pines, Miami, FL 33133For SaleMLS ID #A12104432, Jorge Trujillo, Luxury Real Estate Group LLC. MIAMI
- $800,0002 bd3 ba1.1k sqft55 Merrick Way Condo, Coral Gables, FL 33134For SaleMLS ID #A12122956, Pedro Salgado, Prestige Properties Internatio. MIAMI
- $1,180,0002 bd2 ba1k sqftCoral Gables Crafts Sec, Coral Gables, FL 33134For SaleMLS ID #A12120660, Mauricio Barba PA, Compass Florida, LLC. MIAMI
- $1,265,0003 bd2 ba1.6k sqftCoconut Gr Sec 1 C Gab, Coral Gables, FL 33134For SaleMLS ID #A12091853, Andres Betancourt, Moyal Capital Investments LLC. MIAMI
- $825,0003 bd3 ba1.8k sqftSilver Bluff Hmsts, Miami, FL 33133For SaleMLS ID #A12048124, Monica Gonzalez, London Foster Realty. MIAMI
- $609,9002 bd2 ba1.1k sqftBiltmore Ii Condo, Coral Gables, FL 33134For SaleMLS ID #A12124790, Irma Diaz, Century 21 Dorar Realty. MIAMI
- $969,0005 bd3 ba2k sqftAmnd Plat Of Miami Suburb, Miami, FL 33145For SaleMLS ID #A12094959, Richard Carey, LoKation. MIAMI
- $850,0002 bd3 ba1.2k sqft100 Andalusia, Coral Gables, FL 33134For SaleMLS ID #A12035637, Maria Somoza, BHHS EWM Realty. MIAMI
- $720,0003 bd2 ba1.1k sqftThe Gallery, Coral Gables, FL 33134For SaleMLS ID #A12120476, Denise Castro, Real Estate Sales Force. MIAMI
- $895,0002 bd2 ba960 sqftTree House Townhouse, Miami, FL 33133For SaleMLS ID #A12102454, Anzhelika Peshkova, Core Realty Associates, Inc.. MIAMI
