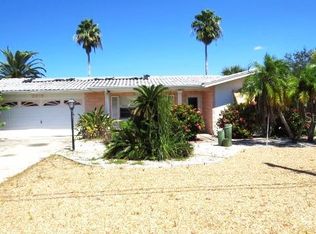
This is a 1377 square foot, 2.0 bathroom, single family home. This home is located at 3907 Headsail Dr, New Port Richey, FL 34652.
Pre-foreclosure
Street View
Est. $403,700
3907 Headsail Dr, New Port Richey, FL 34652
--beds
2baths
1,377sqft
SingleFamily
Built in 1967
7,753 Square Feet Lot
$403,700 Zestimate®
$293/sqft
$8/mo HOA
Overview
- 366 days |
- 7 |
- 0 |
Facts & features
Interior
Bedrooms & bathrooms
- Bathrooms: 2
Heating
- Forced air
Cooling
- Central
Features
- Flooring: Carpet
Interior area
- Total interior livable area: 1,377 sqft
Property
Parking
- Parking features: Garage - Attached
Features
- Exterior features: Stucco
- Has view: Yes
- View description: Water
- Has water view: Yes
- Water view: Water
Lot
- Size: 7,753 Square Feet
Details
- Parcel number: 1226150070010000050
Construction
Type & style
- Home type: SingleFamily
Materials
- Concrete Block
- Roof: Built-up
Condition
- Year built: 1967
Community & HOA
HOA
- Has HOA: Yes
- HOA fee: $8 monthly
Location
- Region: New Port Richey
Financial & listing details
- Price per square foot: $293/sqft
- Tax assessed value: $397,274
- Annual tax amount: $7,068
Visit our professional directory to find a foreclosure specialist in your area that can help with your home search.
Find a foreclosure agentForeclosure details
Estimated market value
$403,700
$371,000 - $440,000
$2,272/mo
Price history
| Date | Event | Price |
|---|---|---|
| 10/3/2025 | Listing removed | $598,000$434/sqft |
Source: | ||
| 9/19/2025 | Price change | $598,000-0.2%$434/sqft |
Source: | ||
| 8/4/2025 | Price change | $599,000-3.2%$435/sqft |
Source: | ||
| 5/22/2025 | Listed for sale | $619,000+54.8%$450/sqft |
Source: | ||
| 11/7/2022 | Sold | $400,000-11.1%$290/sqft |
Source: Public Record Report a problem | ||
| 8/26/2022 | Pending sale | $450,000$327/sqft |
Source: | ||
| 8/9/2022 | Price change | $450,000-5.3%$327/sqft |
Source: | ||
| 7/29/2022 | Pending sale | $475,000$345/sqft |
Source: | ||
| 7/22/2022 | Price change | $475,000-4%$345/sqft |
Source: | ||
| 7/10/2022 | Listed for sale | $495,000$359/sqft |
Source: | ||
| 6/30/2022 | Listing removed | -- |
Source: | ||
| 6/24/2022 | Listed for sale | $495,000$359/sqft |
Source: | ||
| 6/23/2022 | Pending sale | $495,000$359/sqft |
Source: | ||
| 6/7/2022 | Price change | $495,000-5.7%$359/sqft |
Source: | ||
| 6/3/2022 | Pending sale | $525,000$381/sqft |
Source: | ||
| 5/27/2022 | Listed for sale | $525,000$381/sqft |
Source: | ||
| 5/17/2022 | Pending sale | $525,000$381/sqft |
Source: | ||
| 5/13/2022 | Listed for sale | $525,000$381/sqft |
Source: | ||
Public tax history
| Year | Property taxes | Tax assessment |
|---|---|---|
| 2024 | $7,068 +1.1% | $397,274 +2.4% |
| 2023 | $6,993 +325.6% | $388,006 +26.3% |
| 2022 | $1,643 +2.5% | $307,172 +139.3% |
| 2021 | $1,603 +2% | $128,370 +1.4% |
| 2020 | $1,571 +2.3% | $126,600 +2.3% |
| 2019 | $1,536 | $123,760 +1.9% |
| 2018 | $1,536 +2.3% | $121,458 |
| 2017 | $1,501 +0.8% | $121,458 +4.2% |
| 2016 | $1,489 +2.9% | $116,513 +0.7% |
| 2015 | $1,447 +3.1% | $115,703 -27.2% |
| 2014 | $1,404 | $158,891 +1.9% |
| 2013 | -- | $155,965 +5.7% |
| 2012 | -- | $147,543 -5.5% |
| 2011 | -- | $156,174 +2.7% |
| 2010 | -- | $152,060 -13.6% |
| 2009 | -- | $175,928 -23.7% |
| 2008 | -- | $230,582 -18.3% |
| 2007 | -- | $282,399 -8.1% |
| 2006 | -- | $307,343 +40.4% |
| 2005 | -- | $218,842 +21.2% |
| 2004 | -- | $180,566 +10.1% |
| 2003 | -- | $164,008 +47.7% |
| 2002 | -- | $111,070 +31.3% |
| 2000 | -- | $84,598 |
| 1999 | -- | $84,598 |
Find assessor info on the county website
Monthly payment
Estimated monthly payment$1,822
All calculations are estimates and provided by Zillow, Inc. for informational purposes only. Actual amounts may vary.
HOA fees may include property taxes on listings classified as Co-Ops. Contact the listing agent and/or owner for fee details.
Mortgage interest rates are dependent on a number of factors, including credit score, down payment, and repayment length. Interest rate data provided by Zillow Group Marketplace, Inc. as of 1/1/1970 from various mortgage lenders with which we have lead or other similar arrangements; the Estimated Payment is an average of those rates.
See how much you could borrow to make a competitive offer.
Climate risks
Neighborhood: Flor-A-Mar
Nearby schools
GreatSchools rating
- 7/10James M. Marlowe Elementary SchoolGrades: PK-5Distance: 1.8 mi
- 2/10Gulf Middle SchoolGrades: 6-8Distance: 2.6 mi
- 3/10Gulf High SchoolGrades: 9-12Distance: 2.1 mi


- Florida
- Pasco County
- New Port Richey
- 34652
- Flor-A-Mar
- 3907 Headsail Dr
Nearby cities
Nearby neighborhoods
Nearby zip codes
Other New Port Richey Topics
