Enjoy peaceful country living in this charming 3-bedroom, 1-bath home in Walland, TN! This 912 sq. ft. of living space
with beautiful countryside views, this home features LVP flooring throughout, The exterior offers a new metal roof,
low-maintenance vinyl siding and a welcoming covered front porch, perfect for relaxing and enjoying the peaceful
surroundings.
Active
$250,000
3957 Payne Hollow Rd, Walland, TN 37886
3beds
912sqft
Single Family Residence
Built in 1977
0.27 Acres Lot
$-- Zestimate®
$274/sqft
$-- HOA
What's special
Low-maintenance vinyl sidingNew metal roofWelcoming covered front porchLvp flooring throughoutBeautiful countryside views
- 34 days
- 878
- 46
Zillow last checked:
Listing updated:
Listed by:
Kendra Greene Ellis 865-437-7433,
Wallace 865-687-1111
Source: East Tennessee Realtors,MLS#: 1358406
Facts & features
Interior
Bedrooms & bathrooms
- Bedrooms: 3
- Bathrooms: 1
- Full bathrooms: 1
Heating
- Central, Electric
Cooling
- Central Air
Appliances
- Included: Microwave, Range, Refrigerator, Self Cleaning Oven
Features
- Eat-in Kitchen
- Flooring: Sustainable
- Basement: None
- Has fireplace: No
- Fireplace features: None
Interior area
- Total structure area: 912
- Total interior livable area: 912 sqft
Property
Parking
- Parking features: Detached
Features
- Has view: Yes
- View description: Country Setting
Lot
- Size: 0.27 Acres
- Dimensions: 85 x 139
- Features: Level
Details
- Additional structures: Storage
- Parcel number: 071 033.01
Construction
Type & style
- Home type: SingleFamily
- Architectural style: Traditional
- Property subtype: Single Family Residence
Materials
- Vinyl Siding, Frame
Condition
- Year built: 1977
Utilities & green energy
- Sewer: Septic Tank
- Water: Well
Community & HOA
Community
- Security: Smoke Detector(s)
HOA
- Has HOA: No
Location
- Region: Walland
Financial & listing details
- Price per square foot: $274/sqft
- Tax assessed value: $122,000
- Annual tax amount: $485
- Date on market: 10/9/2026
Estimated market value
Not available
Estimated sales range
Not available
Not available
Price history
| Date | Event | Price |
|---|---|---|
| 10/9/2026 | Listed for sale | $250,000+42%$274/sqft |
Source:  East Tennessee Realtors #1358406 Report a problem | ||
| 10/24/2024 | Sold | $176,000+46.7%$193/sqft |
Source: East Tennessee Realtors #1273862 Report a problem | ||
| 5/20/2024 | Sold | $120,000+200%$132/sqft |
Source: Public Record Report a problem | ||
| 1/4/2016 | Sold | $40,000-24.4%$44/sqft |
Source: Public Record Report a problem | ||
| 11/3/2015 | Price change | $52,900-11.7%$58/sqft |
Source: Coldwell Banker Nelson Realtors #940636 Report a problem | ||
| 10/20/2015 | Listed for sale | $59,900$66/sqft |
Source: Coldwell Banker Nelson Realtors #940636 Report a problem | ||
| 10/8/2015 | Pending sale | $59,900$66/sqft |
Source: Coldwell Banker Nelson Realtors #940636 Report a problem | ||
| 10/6/2015 | Listed for sale | $59,900+232.8%$66/sqft |
Source: Coldwell Banker Nelson Realtors #940636 Report a problem | ||
| 10/1/2010 | Sold | $18,000-39.8%$20/sqft |
Source: Public Record Report a problem | ||
| 7/30/2010 | Price change | $29,900-14.3%$33/sqft |
Source: Realty Executives Associates #716693 Report a problem | ||
| 6/27/2010 | Price change | $34,900-16.7%$38/sqft |
Source: Realty Executives Associates Report a problem | ||
| 5/30/2010 | Listed for sale | $41,900-16.6%$46/sqft |
Source: Realty Executives Associates #716693 Report a problem | ||
| 4/27/2010 | Sold | $50,250-32.9%$55/sqft |
Source: Public Record Report a problem | ||
| 4/26/2009 | Listing removed | $74,900$82/sqft |
Source: Century 21 #649407 Report a problem | ||
| 1/29/2009 | Listed for sale | $74,900+13.5%$82/sqft |
Source: Century 21 #649407 Report a problem | ||
| 7/6/2007 | Sold | $66,000$72/sqft |
Source: Public Record Report a problem | ||
Public tax history
| Year | Property taxes | Tax assessment |
|---|---|---|
| 2025 | $485 | $30,500 |
| 2024 | $485 | $30,500 |
| 2023 | $485 +38% | $30,500 +114.4% |
| 2022 | $351 | $14,225 |
| 2021 | $351 | $14,225 |
| 2020 | $351 | $14,225 |
| 2019 | $351 +5.4% | $14,225 +5.4% |
| 2018 | $333 +2.3% | $13,500 |
| 2017 | $326 | $13,500 |
| 2016 | $326 +12.3% | $13,500 |
| 2015 | $290 | $13,500 |
| 2014 | -- | $13,500 -7.4% |
| 2013 | $313 | $14,575 |
| 2012 | $313 -0.1% | $14,575 +0% |
| 2011 | $313 +5.4% | $14,573 |
| 2010 | $297 | $14,573 |
| 2009 | -- | $14,573 +6.8% |
| 2008 | $304 | $13,639 |
| 2007 | $304 +2.3% | $13,639 |
| 2006 | $297 -10.3% | $13,639 |
| 2005 | $331 +37.3% | $13,639 +21.5% |
| 2004 | $241 | $11,225 |
| 2002 | $241 | $11,225 |
| 2001 | -- | $11,225 -75% |
| 2000 | -- | $44,899 |
Find assessor info on the county website
Monthly payment
Est. payment
Payment breakdown
Explore the cost of this home by adjusting the details. Changes won't be saved.Climate risks
Neighborhood: 37886

Similar homes
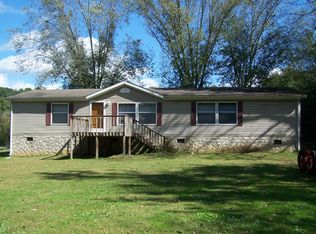
- $224,9003 bd2 ba1.2k sqft2030 Six Mile Rd, Maryville, TN 37803Active

 MLS ID #1351841, Kathy H. Parker, Wallace Nelson Real Estate. East Tennessee Realtors
- $285,0003 bd1 ba1k sqft1602 Garfield St, Alcoa, TN 37701Active
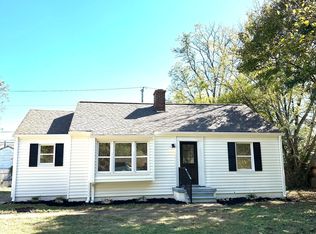 MLS ID #1360268, Tiffany Jones, Trelora Realty, Inc. East Tennessee Realtors
- $274,9002 bd1 ba861 sqft318 Extine Ln, Knoxville, TN 37920Active
 MLS ID #1360966, Brandon Hutchison, Keller Williams West Knoxville. East Tennessee Realtors
- $224,9002 bd1 ba804 sqft404 N 5th St, Maryville, TN 37804Active
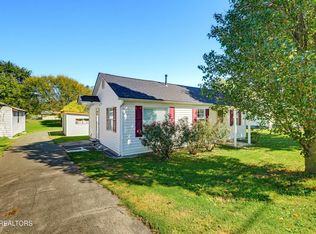 MLS ID #1359844, Jenny Moynihan Wilson, ReMax First. East Tennessee Realtors
- $237,9003 bd1 ba953 sqft5419 Bland Ln, Knoxville, TN 37920ActiveMLS ID #1344489, Lori A Dawson, Southern Charm Homes. East Tennessee Realtors
- $269,9003 bd1 ba1.2k sqft6520 Jackie Ln, Knoxville, TN 37920ActiveMLS ID #1354845, Erica Douglas, NBS Property Management. East Tennessee Realtors
- $299,9003 bd2 ba1k sqft7420 Lunaria Rd, Knoxville, TN 37920ActiveMLS ID #1361036, Felicia Cardwell, Southern Charm Homes. East Tennessee Realtors
- $320,0003 bd2 ba1.3k sqft400 Contentment Ln, Knoxville, TN 37920ActiveMLS ID #1361737, Michael Oxford, MG Rise Real Estate Group. East Tennessee Realtors
- $279,0003 bd1 ba850 sqft1113 Ownby Ln, Knoxville, TN 37919ActiveMLS ID #1359331, Frank Goswitz, EXP Realty, LLC. East Tennessee Realtors
- $266,0003 bd2 ba1k sqft653 Lee Shirley Rd, Maryville, TN 37801ActiveMLS ID #1361452, Mike Howell, Realty Executives Associates. East Tennessee Realtors
- $248,0002 bd1 ba792 sqft3410 Feathers St, Knoxville, TN 37920ActiveMLS ID #1357608, Donnie Day, Day & Associates. East Tennessee Realtors
- $225,9004 bd2 ba1.3k sqft1812 Rosedale Ave, Knoxville, TN 37915ActiveMLS ID #1347338, Phuong Nguyen, The Real Estate Firm, Inc.. East Tennessee Realtors
- $240,0003 bd1 ba900 sqft820 S Castle St, Knoxville, TN 37914ActiveMLS ID #1359708, Steven Lee Hensley, SCH Real Estate, Realty Executives. East Tennessee Realtors
- $285,0002 bd1 ba1k sqft2334 Old Knoxville Pike, Maryville, TN 37804ActiveMLS ID #1358503, Troy Galyon, LeConte Realty, LLC. East Tennessee Realtors
- $230,0002 bd1 ba1.1k sqft2515 Mentor Rd, Louisville, TN 37777ActiveMLS ID #1360050, Seth Rigsby, ReMax First. East Tennessee Realtors
- $274,9003 bd2 ba1.1k sqft2519 SE Seaton Ave, Knoxville, TN 37920ActiveMLS ID #1349579, Terri Sykes, Crown and Anchor Realty. East Tennessee Realtors
- $225,0002 bd1 ba857 sqft2376 Pennsylvania Ave, Maryville, TN 37804For Sale
 MLS ID #3604114, Sara Price. RealTracs MLS as distributed by MLS GRID
- $273,0002 bd2 ba857 sqft1310 Madison Ave, Maryville, TN 37804ActiveMLS ID #1350534, Sandor Pardi, Lakefront Living, On the Lake. East Tennessee Realtors
- $209,9002 bd1 ba932 sqft7421 Sevierville Pike, Knoxville, TN 37920ActiveMLS ID #1358314, Kelly Sapp, Keller Williams. East Tennessee Realtors
