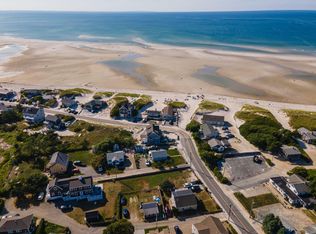
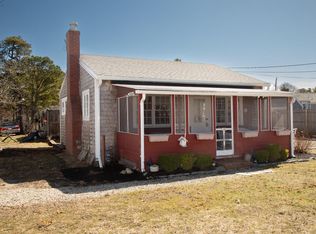
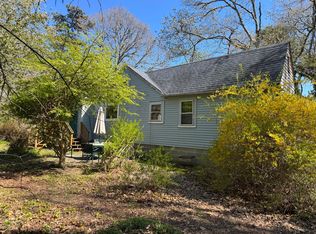
ucked between the iconic sandy paths of Mayflower and Chapin Beaches, this charming two-bedroom bungalow offers a rare chance to own in one of Cape Cod's most coveted areas. Just 350 feet to the beach, the home sits in a prime location surrounded by dunes, salty breezes, and summer magic. This is more than just a getaway, it's a canvas for your dream beach house. Approved architectural plans are already in place and included with the sale, allowing the future owner to transform the property into a stunning three-bedroom, two-story home. Whether you're envisioning a serene retreat or a family summer escape, this is your opportunity to reimagine coastal living at its finest.
For sale
$975,000
4 Spadoni Rd, Dennis, MA 02638
2beds
453sqft
Single Family Residence
Built in 1929
3,920 Square Feet Lot
$893,100 Zestimate®
$2,152/sqft
$-- HOA
What's special
- 301 days |
- 850 |
- 18 |
Zillow last checked:
Listing updated:
Listed by:
Paul McCormick 508-776-1936,
Gibson Sotheby's International Realty 508-432-6100
Source: MLS PIN,MLS#: 73418040
Loading...
Facts & features
Interior
Bedrooms & bathrooms
- Bedrooms: 2
- Bathrooms: 1
- Full bathrooms: 1
Heating
- Natural Gas, None
Cooling
- Heat Pump
Features
- Has basement: No
- Number of fireplaces: 1
Interior area
- Total structure area: 453
- Total interior livable area: 453 sqft
- Finished area above ground: 453
Property
Parking
- Total spaces: 6
- Uncovered spaces: 6
Features
- Waterfront features: 0 to 1/10 Mile To Beach
Lot
- Size: 3,920 Square Feet
- Features: Level
Details
- Parcel number: M:000322 P:019000,2280670
- Zoning: RES
Construction
Type & style
- Home type: SingleFamily
- Architectural style: Cottage
- Property subtype: Single Family Residence
Materials
- Foundation: Block
Condition
- Year built: 1929
Utilities & green energy
- Sewer: Private Sewer
- Water: Public
Community & HOA
HOA
- Has HOA: No
Location
- Region: Dennis
Financial & listing details
- Price per square foot: $2,152/sqft
- Tax assessed value: $807,800
- Annual tax amount: $3,498
- Date on market: 8/17/2025
Estimated market value
$893,100
$848,000 - $938,000
$2,202/mo
Price history
| Date | Event | Price |
|---|---|---|
| 9/17/2025 | Price change | $975,000-15.2%$2,152/sqft |
Source: MLS PIN #73418040 Report a problem | ||
| 8/14/2025 | Listed for sale | $1,150,000-16.4%$2,539/sqft |
Source: MLS PIN #73418040 Report a problem | ||
| 6/10/2025 | Listing removed | $1,375,000$3,035/sqft |
Source: MLS PIN #73311772 Report a problem | ||
| 11/12/2024 | Listed for sale | $1,375,000+175%$3,035/sqft |
Source: MLS PIN #73311772 Report a problem | ||
| 7/24/2019 | Sold | $500,000+358.5%$1,104/sqft |
Source: Public Record Report a problem | ||
| 10/26/1989 | Sold | $109,040$241/sqft |
Source: Public Record Report a problem | ||
Public tax history
| Year | Property taxes | Tax assessment |
|---|---|---|
| 2025 | $3,498 +5.2% | $807,800 +6.6% |
| 2024 | $3,326 +19% | $757,600 +26.6% |
| 2023 | $2,795 -4.4% | $598,500 +14.7% |
| 2022 | $2,923 -3.1% | $521,900 +4.3% |
| 2021 | $3,017 +4.1% | $500,400 +5.3% |
| 2020 | $2,899 +7.4% | $475,300 +8.7% |
| 2019 | $2,698 +0.4% | $437,300 +3.2% |
| 2018 | $2,687 +2.7% | $423,800 -0.4% |
| 2017 | $2,616 +5.3% | $425,400 +11.8% |
| 2016 | $2,485 +2.1% | $380,500 |
| 2015 | $2,435 +2.8% | $380,500 +2% |
| 2014 | $2,369 +4.2% | $373,000 -0.1% |
| 2013 | $2,274 +2.6% | $373,400 -1% |
| 2012 | $2,217 +1% | $377,100 -4% |
| 2011 | $2,196 +0.6% | $392,900 -5.1% |
| 2010 | $2,183 +7.5% | $414,200 +3.4% |
| 2009 | $2,031 +107.2% | $400,600 +77.7% |
| 2008 | $980 +3.2% | $225,400 -0.3% |
| 2007 | $950 -4.3% | $226,100 -3% |
| 2006 | $993 -1.1% | $233,100 +6.1% |
| 2005 | $1,004 +10.5% | $219,600 +17.7% |
| 2004 | $909 +10.2% | $186,600 +29.2% |
| 2003 | $825 +7.4% | $144,400 +41.8% |
| 2001 | $768 | $101,800 |
Find assessor info on the county website
Monthly payment
Est. payment$--/mo
Payment breakdown
Explore the cost of this home by adjusting the details. Changes won't be saved.All calculations are estimates and provided by Zillow, Inc. for informational purposes only. Actual amounts may vary.
HOA fees may include property taxes on listings classified as Co-Ops. Contact the listing agent and/or owner for fee details.
Mortgage interest rates are dependent on a number of factors, including credit score, down payment, and repayment length. Interest rate data provided by Zillow Group Marketplace, Inc. as of 1/1/1970 from various mortgage lenders with which we have lead or other similar arrangements; the Estimated Payment is an average of those rates.
See how much you could borrow to make a competitive offer.
Climate risks
Neighborhood: North Dennis
Nearby schools
GreatSchools rating
- 4/10Dennis-Yarmouth Intermediate SchoolGrades: 4-5Distance: 4.1 mi
- 6/10Dennis-Yarmouth Middle SchoolGrades: 6-7Distance: 4.1 mi
- 4/10Dennis-Yarmouth Regional High SchoolGrades: 8-12Distance: 4.5 mi
A local agent can set up tours, give advice and negotiate with sellers.


Nearby cities
Nearby neighborhoods
Nearby zip codes
Other Dennis Topics
