Rare multi-family offering at 400 E Lancaster Blvd. Well-maintained 4plex offering stable income, low operating expenses, and consistent tenant demand. Highlights include individual metering, functional layouts, onsite parking, and strong proximity to Lancaster’s revitalized downtown, local schools, and major commuter corridors. Excellent addition for any buy-and-hold investor seeking reliable returns and future appreciation in a growing submarket. Drive-by only; write offers subject to inspection.
For sale by owner
$640,000
400 E Lancaster Blvd, Lancaster, CA 93535
4beds
2,688sqft
SingleFamily
Built in 1955
6,970 Square Feet Lot
$-- Zestimate®
$238/sqft
$-- HOA
What's special
Functional layoutsIndividual meteringOnsite parking
What the owner loves about this home
Fully occupied, this property brings in over $7000 per month in rents
- 32 days
- 245
- 6
Listed by:
Property Owner (562) 230-9762
Facts & features
Interior
Bedrooms & bathrooms
- Bedrooms: 4
- Bathrooms: 4
- Full bathrooms: 4
Cooling
- None
Interior area
- Total interior livable area: 2,688 sqft
Property
Parking
- Parking features: None
Lot
- Size: 6,970 Square Feet
Details
- Parcel number: 3142016002
Construction
Type & style
- Home type: SingleFamily
Condition
- New construction: No
- Year built: 1955
Community & HOA
Location
- Region: Lancaster
Financial & listing details
- Price per square foot: $238/sqft
- Tax assessed value: $576,672
- Date on market: 9/17/2026
Estimated market value
Not available
Estimated sales range
Not available
$3,088/mo
Price history
| Date | Event | Price |
|---|---|---|
| 10/2/2026 | Listed for rent | $2,060$1/sqft |
Source: Zillow Rentals Report a problem | ||
| 9/17/2026 | Listed for sale | $640,000$238/sqft |
Source: Owner Report a problem | ||
| 9/15/2026 | Listing removed | $640,000$238/sqft |
Source:  GAVAR #26006396 Report a problem | ||
| 9/15/2026 | Listed for sale | $640,000$238/sqft |
Source: GAVAR #26006396 Report a problem | ||
| 9/3/2026 | Pending sale | $640,000$238/sqft |
Source: GAVAR #26006396 Report a problem | ||
| 8/15/2026 | Listing removed | $2,060$1/sqft |
Source: Zillow Rentals Report a problem | ||
| 8/14/2026 | Listed for sale | $640,000+20.3%$238/sqft |
Source: GAVAR #26006396 Report a problem | ||
| 6/5/2026 | Listed for rent | $2,060+14.4%$1/sqft |
Source: Zillow Rentals Report a problem | ||
| 11/14/2022 | Price change | $1,800+12.5%$1/sqft |
Source: Zillow Rental Network_1 Report a problem | ||
| 9/11/2022 | Price change | $1,600+10.3%$1/sqft |
Source: Zillow Rental Network_1 Report a problem | ||
| 9/9/2022 | Price change | $1,450-20.5%$1/sqft |
Source: Zillow Rental Network_1 Report a problem | ||
| 9/7/2022 | Listed for rent | $1,825$1/sqft |
Source: Zillow Rental Network_1 Report a problem | ||
| 4/4/2022 | Sold | $532,000+0.4%$198/sqft |
Source: GAVAR #22002215 Report a problem | ||
| 3/18/2022 | Pending sale | $530,000$197/sqft |
Source: GAVAR #22002215 Report a problem | ||
| 3/13/2022 | Listed for sale | $530,000+748%$197/sqft |
Source:  CRMLS #SR22048718 Report a problem | ||
| 11/14/1995 | Sold | $62,500+13.6%$23/sqft |
Source: Public Record Report a problem | ||
| 7/28/1994 | Sold | $55,000$20/sqft |
Source: Public Record Report a problem | ||
Public tax history
| Year | Property taxes | Tax assessment |
|---|---|---|
| 2026 | -- | $576,672 +2% |
| 2025 | $9,323 +4% | $565,381 +2% |
| 2024 | $8,963 +2% | $554,312 +2% |
| 2023 | $8,790 +1.5% | $543,460 +257% |
| 2022 | $8,659 +116.7% | $152,224 +2% |
| 2021 | $3,997 +0.8% | $149,256 +1% |
| 2020 | $3,964 | $147,735 +2% |
| 2019 | $3,964 +3% | $144,855 +2% |
| 2018 | $3,850 | $142,032 +2.6% |
| 2017 | $3,850 +1% | $138,444 +2% |
| 2016 | $3,813 +3.5% | $135,730 +1.5% |
| 2015 | $3,684 +2% | $133,692 +2% |
| 2014 | $3,610 | $131,074 +2.5% |
| 2012 | -- | $127,925 +2% |
| 2011 | -- | $125,418 +0.8% |
| 2010 | -- | $124,481 -0.2% |
| 2009 | -- | $124,777 +2% |
| 2008 | -- | $122,332 +2% |
| 2007 | -- | $119,934 +2% |
| 2006 | -- | $117,583 |
| 2005 | -- | $117,583 +4% |
| 2004 | -- | $113,018 +1.9% |
| 2003 | -- | $110,947 +57.9% |
| 2002 | -- | $70,279 +4% |
| 2000 | -- | $67,552 |
Find assessor info on the county website
Monthly payment
Est. payment
Payment breakdown
Explore the cost of this home by adjusting the details. Changes won't be saved.Climate risks
Neighborhood: 93535


Similar homes
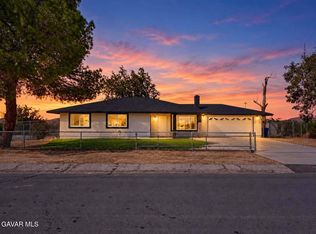
- $501,0006 bd2 ba1.9k sqft49019 120th St E, Lancaster, CA 93535For Sale
 MLS ID #26000451, Cleone Murphy. GAVAR
- $449,9003 bd2 ba1.4k sqft16605 Valeport Ave, Lancaster, CA 93535For Sale
 MLS ID #26007943, Israel Sanchez. GAVAR
- $514,9004 bd3 ba2.2k sqft1818 Linda Vista Ave, Lancaster, CA 93535For Sale
 MLS ID #26007146, Victoria Erfle. GAVAR
- $499,9004 bd3 ba2.1k sqft1642 Lauterbach St, Lancaster, CA 93535For Sale
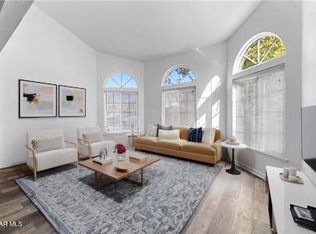 MLS ID #26007632, Margaret Blanchard. GAVAR
Local buyer's agents are ready to help
