Under contract before processing
Pending
$220,000
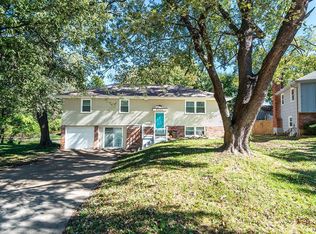
401 SE Franklin Ct, Blue Springs, MO 64014
3beds
1,830sqft
Single Family Residence
Built in 1993
10,476 Square Feet Lot
$-- Zestimate®
$120/sqft
$-- HOA
What's special
- 43 days
- 20
- 0
Zillow last checked:
Listing updated:
Listed by:
Michael Foote 816-456-2678,
Platinum Realty LLC
Source: Heartland MLS as distributed by MLS GRID,MLS#: 2641233
Facts & features
Interior
Bedrooms & bathrooms
- Bedrooms: 3
- Bathrooms: 2
- Full bathrooms: 2
Heating
- Natural Gas
Cooling
- Electric
Features
- Basement: Full
- Number of fireplaces: 1
Interior area
- Total structure area: 1,830
- Total interior livable area: 1,830 sqft
- Finished area above ground: 1,830
- Finished area below ground: 0
Property
Parking
- Total spaces: 2
- Parking features: Attached
- Attached garage spaces: 2
Lot
- Size: 10,476 Square Feet
Details
- Parcel number: 41440143500000000
- Special conditions: Short Sale
Construction
Type & style
- Home type: SingleFamily
- Property subtype: Single Family Residence
Materials
- Frame
- Roof: Composition
Condition
- Year built: 1993
Utilities & green energy
- Sewer: Public Sewer
- Water: Public
Community & HOA
Community
- Subdivision: Moreland Village
HOA
- Has HOA: No
Location
- Region: Blue Springs
Financial & listing details
- Price per square foot: $120/sqft
- Tax assessed value: $228,790
- Annual tax amount: $3,577
- Date on market: 9/9/2026
- Listing terms: Cash,Conventional
- Ownership: Estate/Trust
Estimated market value
Not available
Estimated sales range
Not available
Not available
Price history
| Date | Event | Price |
|---|---|---|
| 9/9/2026 | Pending sale | $220,000-24.1%$120/sqft |
Source:  Heartland MLS as distributed by MLS GRID #2641233 Report a problem | ||
| 10/7/2023 | Listing removed | -- |
Source: Heartland MLS as distributed by MLS GRID #2452055 Report a problem | ||
| 9/3/2023 | Pending sale | $290,000$158/sqft |
Source: Heartland MLS as distributed by MLS GRID #2452055 Report a problem | ||
| 8/31/2023 | Listed for sale | $290,000+100.1%$158/sqft |
Source: Heartland MLS as distributed by MLS GRID #2452055 Report a problem | ||
| 12/7/2012 | Sold | -- |
Source: Heartland MLS as distributed by MLS GRID #1793359 Report a problem | ||
| 11/1/2012 | Pending sale | $144,900$79/sqft |
Source: Platinum Realty #1793359 Report a problem | ||
| 10/5/2012 | Listed for sale | $144,900$79/sqft |
Source: Platinum Realty #1793359 Report a problem | ||
| 9/13/2012 | Pending sale | $144,900$79/sqft |
Source: Platinum Realty #1793359 Report a problem | ||
| 8/23/2012 | Price change | $144,900-2.7%$79/sqft |
Source: Platinum Realty #1793359 Report a problem | ||
| 7/13/2012 | Price change | $148,900-6.9%$81/sqft |
Source: Visual Tour #1771856 Report a problem | ||
| 6/2/2012 | Price change | $159,900-3.1%$87/sqft |
Source: Visual Tour #1771856 Report a problem | ||
| 3/29/2012 | Listed for sale | $165,000$90/sqft |
Source: Visual Tour #1771856 Report a problem | ||
Public tax history
| Year | Property taxes | Tax assessment |
|---|---|---|
| 2025 | $3,577 -12.6% | $43,471 -12.9% |
| 2024 | $4,091 +1.9% | $49,911 |
| 2023 | $4,013 +34.2% | $49,911 +51.8% |
| 2022 | $2,991 +0.1% | $32,871 |
| 2021 | $2,988 +6.7% | $32,871 +5% |
| 2020 | $2,800 +3.4% | $31,308 |
| 2019 | $2,708 | $31,308 +16% |
| 2018 | $2,708 +9% | $26,987 |
| 2017 | $2,484 +4.8% | $26,987 +2% |
| 2016 | $2,370 -3.3% | $26,467 -3.2% |
| 2014 | $2,452 +0.5% | $27,335 |
| 2013 | $2,438 +0.1% | $27,335 |
| 2012 | $2,437 +0.3% | $27,335 |
| 2011 | $2,428 +1.8% | $27,335 |
| 2010 | $2,385 -5.7% | $27,335 |
| 2009 | $2,528 +1.8% | $27,335 -6% |
| 2008 | $2,483 +8.6% | $29,080 |
| 2007 | $2,287 +0% | $29,080 +9% |
| 2006 | $2,286 +2% | $26,678 |
| 2005 | $2,242 -0.1% | $26,678 +3% |
| 2004 | $2,245 +23.8% | $25,901 |
| 2003 | $1,813 +5.2% | $25,901 +15% |
| 2002 | $1,723 +1.1% | $22,523 |
| 2001 | $1,704 | $22,523 |
Find assessor info on the county website
Monthly payment
Est. payment
Payment breakdown
Explore the cost of this home by adjusting the details. Changes won't be saved.Climate risks
Neighborhood: 64014
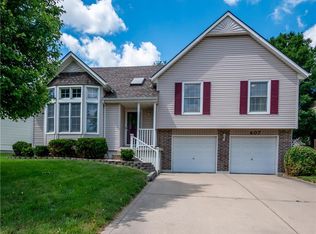
- $335,5004 bd3 ba2.6k sqft407 SE Franklin Ct, Blue Springs, MO 64014Off Market
- $312,0003 bd2 ba1.5k sqft400 SE Hamilton Ct, Blue Springs, MO 64014Off Market
- $278,1003 bd2 ba1.5k sqft415 SE Franklin Ct, Blue Springs, MO 64014Off Market
- $311,9003 bd3 ba1.4k sqft404 SE Hamilton Ct, Blue Springs, MO 64014Off Market

Similar homes
- $220,0004 bd3 ba2.1k sqft1812 SW Mic O Say Ct, Blue Springs, MO 64015Auction
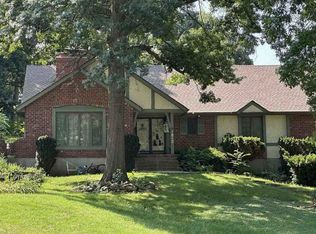 Xome
- $305,0003 bd2 ba1.3k sqft205 SW Kingscross Rd, Blue Springs, MO 64014For Sale
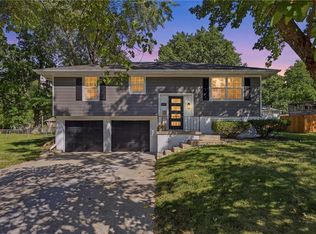 MLS ID #2646083, Jennifer Moriarty, Realty Professionals Heartland. Heartland MLS as distributed by MLS GRID
- $307,0003 bd2 ba2.1k sqft300 NE 6th St, Blue Springs, MO 64014For Sale
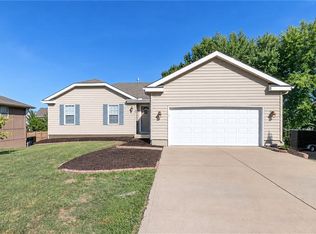 MLS ID #2646222, Grace Parks, SBD Housing Solutions LLC. Heartland MLS as distributed by MLS GRID
- $239,0003 bd3 ba2.2k sqft8401 Arlington Ave, Raytown, MO 64138For Sale
 MLS ID #2647889, Heather Bauer, BHG Kansas City Homes. Heartland MLS as distributed by MLS GRID
