This 909 square foot single family home has 2 bedrooms and 1.0 bathrooms. This home is located at 403 N Filbert St, Stockton, CA 95205.
Pre-foreclosure
Est. $282,800
403 N Filbert St, Stockton, CA 95205
2beds
909sqft
SingleFamily
Built in 1948
3,977 Square Feet Lot
$282,800 Zestimate®
$311/sqft
$-- HOA
Overview
- 50 days
- 16
- 1
Facts & features
Interior
Bedrooms & bathrooms
- Bedrooms: 2
- Bathrooms: 1
- Full bathrooms: 1
Heating
- Wall, Electric, Gas
Cooling
- Wall
Appliances
- Included: Dishwasher
- Laundry: Inside Room
Features
- Dining Room
- Flooring: Tile, Carpet, Hardwood
- Windows: Dual Pane Partial
Interior area
- Total interior livable area: 909 sqft
Property
Parking
- Total spaces: 1
- Parking features: Garage - Detached
Features
- Exterior features: Stucco, Wood, Metal
- Fencing: Back Yard
Lot
- Size: 3,977 Square Feet
- Features: Level, Corner Lot
Details
- Parcel number: 153270140000
- Zoning: RES
- Special conditions: Pending Sale
- Other equipment: Antenna Dish
Construction
Type & style
- Home type: SingleFamily
- Architectural style: Traditional, A-Frame
Materials
- wood frame
- Roof: Composition
Condition
- Year built: 1948
Utilities & green energy
- Sewer: In & Connected
- Water: Public District
- Utilities for property: Natural Gas Connected, All Electric
Community & HOA
Location
- Region: Stockton
Financial & listing details
- Price per square foot: $311/sqft
- Tax assessed value: $211,945
Foreclosure details
Estimated market value
$282,800
$257,000 - $303,000
$1,923/mo
Price history
| Date | Event | Price |
|---|---|---|
| 10/18/2023 | Price change | $229,900+4.5%$253/sqft |
Source: MetroList Services of CA #223083956 Report a problem | ||
| 9/20/2023 | Listed for sale | $219,900$242/sqft |
Source: MetroList Services of CA #223083956 Report a problem | ||
| 9/15/2023 | Pending sale | $219,900$242/sqft |
Source: MetroList Services of CA #223083956 Report a problem | ||
| 8/30/2023 | Listed for sale | $219,900+15.7%$242/sqft |
Source: MetroList Services of CA #223083956 Report a problem | ||
| 7/1/2019 | Sold | $190,000+5.6%$209/sqft |
Source: MetroList Services of CA #19035877 Report a problem | ||
| 5/27/2019 | Pending sale | $179,950$198/sqft |
Source: Paloma Realty Inc. #19035877 Report a problem | ||
| 5/24/2019 | Listed for sale | $179,950+172.7%$198/sqft |
Source: Paloma Realty Inc. #19035877 Report a problem | ||
| 5/16/2014 | Sold | $66,000-22.4%$73/sqft |
Source: MetroList Services of CA #14023039 Report a problem | ||
| 9/25/2013 | Sold | $85,000-5.6%$94/sqft |
Source: MetroList Services of CA #13030103 Report a problem | ||
| 9/18/2013 | Listed for sale | $90,000$99/sqft |
Source: SACM #13030103 Report a problem | ||
| 6/13/2013 | Listing removed | $90,000$99/sqft |
Source: SACM #13030103 Report a problem | ||
| 6/11/2013 | Listed for sale | $90,000+160.9%$99/sqft |
Source: SACM #13030103 Report a problem | ||
| 6/20/2011 | Sold | $34,500-30.9%$38/sqft |
Source: Public Record Report a problem | ||
| 1/9/2011 | Price change | $49,950-9.1%$55/sqft |
Source: PMZ Real Estate #10089852 Report a problem | ||
| 12/19/2010 | Price change | $54,950-6.9%$60/sqft |
Source: PMZ Real Estate #10089852 Report a problem | ||
| 11/18/2010 | Listed for sale | $59,000-66.5%$65/sqft |
Source: PMZ Real Estate #10089852 Report a problem | ||
| 10/26/2004 | Sold | $176,000+193.3%$194/sqft |
Source: Public Record Report a problem | ||
| 7/12/2000 | Sold | $60,000+90.5%$66/sqft |
Source: MetroList Services of CA #132003538 Report a problem | ||
| 3/10/2000 | Sold | $31,500$35/sqft |
Source: Public Record Report a problem | ||
Public tax history
| Year | Property taxes | Tax assessment |
|---|---|---|
| 2026 | -- | $211,945 +2% |
| 2025 | $4,120 +68.1% | $207,790 +2% |
| 2024 | $2,451 +2.4% | $203,716 +2% |
| 2023 | $2,393 +1.6% | $199,722 +2% |
| 2022 | $2,355 +4.1% | $195,807 +2% |
| 2021 | $2,262 -1.9% | $191,968 +1% |
| 2020 | $2,305 +90.9% | $190,000 +103.4% |
| 2019 | $1,208 +1.9% | $93,406 +2% |
| 2018 | $1,186 +5.5% | $91,575 +2% |
| 2017 | $1,124 -1.8% | $89,780 +2% |
| 2016 | $1,144 +5% | $88,020 +1.5% |
| 2015 | $1,090 | $86,699 +2% |
| 2014 | $1,090 | $85,000 +29.7% |
| 2013 | -- | $65,545 +15% |
| 2012 | -- | $57,000 -8.1% |
| 2011 | -- | $62,000 +1.6% |
| 2010 | -- | $61,000 -41.9% |
| 2009 | -- | $105,000 -32.2% |
| 2008 | -- | $154,880 -15.4% |
| 2007 | -- | $183,111 +2% |
| 2006 | -- | $179,520 +2% |
| 2005 | -- | $176,000 +177% |
| 2004 | -- | $63,536 +1.9% |
| 2003 | -- | $62,372 +4% |
| 2002 | -- | $59,950 |
| 2001 | -- | $59,950 |
Find assessor info on the county website
Monthly payment
Climate risks
Neighborhood: Waterloo
Similar homes
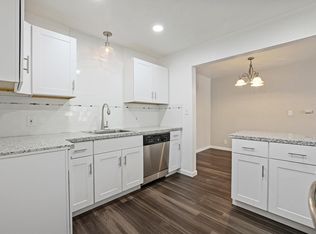
- $--2 bd2 ba1.1k sqft3447 Section Ave, Stockton, CA 95205Auction
 ServiceLink Auction
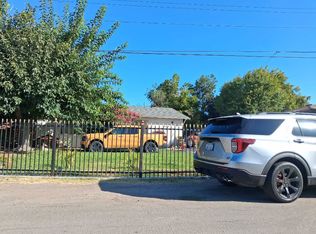
- $--2 bd1 ba984 sqft1023 S Golden Gate Ave, Stockton, CA 95205Auction
 Auction.com 1
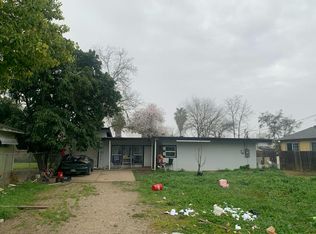
- $--2 bd1 ba803 sqft1616 N Stanford Ave, Stockton, CA 95205Auction
 Auction.com 1
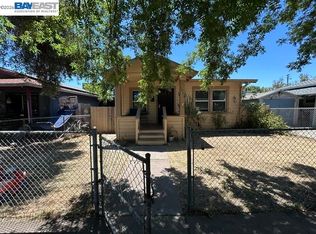
- $305,0002 bd1 ba912 sqft1932 E Lafayette St, Stockton, CA 95205For Sale
 MLS ID #41151117, Tish Charles. Bay East AOR
