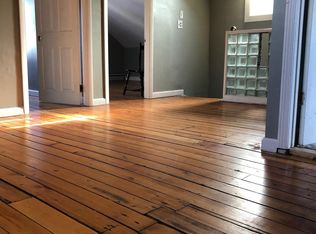
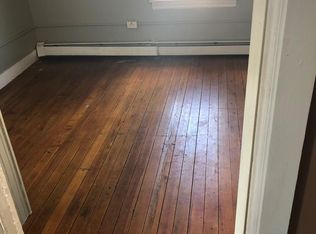
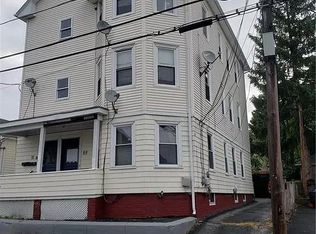
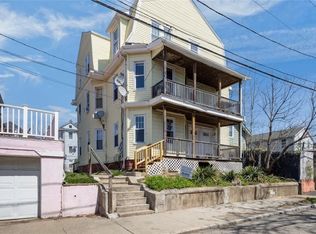
Spacious 3-Family Investment Opportunity. Welcome to a large multi-family property offering a fantastic investment or owner-occupant opportunity. This apartment-style multi family offers 3 apartments Unit 1 boasts 5 bedrooms and 2 bathrooms. Units 2 & 3 each offer 2 bedrooms and 1 bathroom, perfect for tenants seeking comfortable, low-maintenance living. Laminate flooring throughout. Ample off-street parking.
Pending
$649,900
41 Joslin St, Providence, RI 02909
9beds
3,972sqft
Multi Family
Built in 1922
-- sqft lot
$-- Zestimate®
$164/sqft
$-- HOA
What's special
Ample off-street parkingLaminate flooring throughout
- 111 days |
- 25 |
- 0 |
Zillow last checked:
Listing updated:
Listed by:
The ALBA Group,
Innovations Realty
Source: StateWide MLS RI,MLS#: 1406594
Facts & features
Interior
Bedrooms & bathrooms
- Bedrooms: 9
- Bathrooms: 5
- Full bathrooms: 4
- 1/2 bathrooms: 1
Heating
- Natural Gas, Baseboard
Cooling
- None
Appliances
- Included: Gas Water Heater
Features
- Insulation (Unknown)
- Flooring: Ceramic Tile, Hardwood, Laminate
- Basement: Full,Interior Entry,Unfinished
- Has fireplace: No
- Fireplace features: None
Interior area
- Total structure area: 5,411
- Total interior livable area: 3,972 sqft
Property
Parking
- Total spaces: 6
- Parking features: No Garage
Features
- Stories: 3
Lot
- Size: 3,049 Square Feet
Details
- Parcel number: PROVM63L186
- Zoning: R-3
Construction
Type & style
- Home type: MultiFamily
- Property subtype: Multi Family
- Attached to another structure: Yes
Materials
- Vinyl Siding
Condition
- New construction: No
- Year built: 1922
Utilities & green energy
- Electric: 100 Amp Service
- Utilities for property: Sewer Connected, Water Connected
Community & HOA
HOA
- Has HOA: No
Location
- Region: Providence
Financial & listing details
- Price per square foot: $164/sqft
- Tax assessed value: $627,300
- Annual tax amount: $7,366
- Date on market: 3/16/2026
- Total actual rent: 0
Estimated market value
Not available
Estimated sales range
Not available
Not available
Price history
| Date | Event | Price |
|---|---|---|
| 3/31/2026 | Pending sale | $649,900$164/sqft |
Source: | ||
| 3/16/2026 | Listed for sale | $649,900+1.6%$164/sqft |
Source: | ||
| 9/17/2025 | Listing removed | $639,900$161/sqft |
Source: | ||
| 7/22/2025 | Price change | $639,900-1.5%$161/sqft |
Source: | ||
| 6/12/2025 | Price change | $649,900-3.7%$164/sqft |
Source: | ||
| 4/2/2025 | Listed for sale | $674,900$170/sqft |
Source: | ||
| 3/24/2025 | Pending sale | $674,900$170/sqft |
Source: | ||
| 2/28/2025 | Listed for sale | $674,900+50.6%$170/sqft |
Source: | ||
| 5/3/2022 | Sold | $448,000$113/sqft |
Source: | ||
| 2/2/2022 | Pending sale | $448,000+12.3%$113/sqft |
Source: | ||
| 1/13/2021 | Listing removed | $399,000$100/sqft |
Source: | ||
| 12/4/2020 | Listed for sale | $399,000+88.7%$100/sqft |
Source: RE/MAX Innovations #1271199 Report a problem | ||
| 2/7/2018 | Sold | $211,500-3.4%$53/sqft |
Source: | ||
| 11/30/2017 | Price change | $219,000-8.7%$55/sqft |
Source: HomeSmart Professionals RE #1177825 Report a problem | ||
| 11/14/2017 | Listed for sale | $239,900+0.2%$60/sqft |
Source: HomeSmart Professionals RE #1177825 Report a problem | ||
| 5/2/2011 | Sold | $239,475+500.2%$60/sqft |
Source: Public Record Report a problem | ||
| 12/1/2010 | Price change | $39,900-20%$10/sqft |
Source: Home Island Realty, LLC #977807 Report a problem | ||
| 10/10/2010 | Price change | $49,900-9.3%$13/sqft |
Source: Home Island Realty, LLC #977807 Report a problem | ||
| 5/14/2010 | Price change | $55,000-76.3%$14/sqft |
Source: CENTURY 21 Butterman & Kryston, Inc. #966530 Report a problem | ||
| 5/12/2010 | Price change | $232,000+190.4%$58/sqft |
Source: Sawitonline Partners Report a problem | ||
| 8/21/2009 | Listed for sale | $79,900-65.6%$20/sqft |
Source: CENTURY 21 Butterman & Kryston, Inc. #945515 Report a problem | ||
| 11/22/2008 | Listing removed | $232,000$58/sqft |
Source: Owner Report a problem | ||
| 6/22/2008 | Listed for sale | $232,000$58/sqft |
Source: Owner Report a problem | ||
Public tax history
| Year | Property taxes | Tax assessment |
|---|---|---|
| 2025 | $4,736 -35.7% | $627,300 +56.3% |
| 2024 | $7,366 +3.1% | $401,400 |
| 2023 | $7,145 | $401,400 |
| 2022 | $7,145 +17.3% | $401,400 +61.9% |
| 2021 | $6,091 +0% | $248,000 |
| 2020 | $6,091 | $248,000 |
| 2019 | $6,091 +23% | $248,000 +60% |
| 2018 | $4,954 0% | $155,000 |
| 2017 | $4,954 | $155,000 |
| 2016 | $4,954 +12.9% | $155,000 +16.9% |
| 2015 | $4,389 -1.9% | $132,600 |
| 2013 | $4,475 -11.2% | $132,600 -16.1% |
| 2012 | $5,039 +17.1% | $158,000 +17.1% |
| 2011 | $4,302 +5% | $134,900 |
| 2010 | $4,098 -40.6% | $134,900 -52.6% |
| 2009 | $6,895 +6% | $284,800 |
| 2007 | $6,505 +27.4% | $284,800 +68.6% |
| 2006 | $5,106 | $168,900 |
| 2005 | $5,106 | $168,900 |
Find assessor info on the county website
Monthly payment
Est. payment$--/mo
Payment breakdown
Explore the cost of this home by adjusting the details. Changes won't be saved.All calculations are estimates and provided by Zillow, Inc. for informational purposes only. Actual amounts may vary.
HOA fees may include property taxes on listings classified as Co-Ops. Contact the listing agent and/or owner for fee details.
Mortgage interest rates are dependent on a number of factors, including credit score, down payment, and repayment length. Interest rate data provided by Zillow Group Marketplace, Inc. as of 1/1/1970 from various mortgage lenders with which we have lead or other similar arrangements; the Estimated Payment is an average of those rates.
See how much you could borrow to make a competitive offer.
Climate risks
Neighborhood: Olneyville
Nearby schools
GreatSchools rating
- 4/10William D'abate Elementary SchoolGrades: K-5Distance: 0.1 mi
- 2/10Governor Christopher Delsesto Middle SchoolGrades: 6-8Distance: 1.1 mi
- 2/10Mount Pleasant High SchoolGrades: 9-12Distance: 1.1 mi
A local agent can set up tours, give advice and negotiate with sellers.
A local lender can help you make sure your offer is ready when you are.


Nearby cities
Nearby neighborhoods
Nearby zip codes
Other Providence Topics
