Excellent opportunity to own a fully updated three-family property offering modern finishes, spacious layouts, and strong investment potential. Each unit has been thoughtfully renovated with updated kitchens and bathrooms, fresh paint, modern flooring, and updated fixtures throughout. The property offers three separate living spaces, making it ideal for an investor looking to add a turnkey property to their portfolio or an owner-occupant looking to offset their mortgage with rental income. With the major updates already completed, this property is ready for its next owner. Conveniently located near shopping, restaurants, public transportation, and major commuter routes. A great opportunity to own a move-in-ready multifamily property with excellent income potential!
For sale
Price cut: $24K (10/19)
$875,000
42 Summer St, Lawrence, MA 01840
9beds
3,655sqft
3 Family - 3 Units Up/Down
Built in 1900
-- sqft lot
$894,900 Zestimate®
$239/sqft
$-- HOA
What's special
Modern finishesUpdated kitchensThree separate living spacesModern flooringFresh paintSpacious layoutsUpdated fixtures throughout
- 29 days
- 409
- 32
Zillow last checked:
Listing updated:
Listed by:
Justin Melo 978-758-5028,
LAER Realty Partners 978-251-8221
Source: MLS PIN,MLS#: 73585624
Facts & features
Interior
Bedrooms & bathrooms
- Bedrooms: 9
- Bathrooms: 3
- Full bathrooms: 3
Features
- Flooring: Vinyl, Carpet
- Basement: Full
- Has fireplace: No
Interior area
- Total structure area: 3,655
- Total interior livable area: 3,655 sqft
- Finished area above ground: 3,655
Property
Parking
- Total spaces: 1
- Parking features: On Street
- Uncovered spaces: 1
Lot
- Size: 2,139 Square Feet
- Features: Corner Lot
Details
- Parcel number: 4202801
- Zoning: R-3
Construction
Type & style
- Home type: MultiFamily
- Property subtype: 3 Family - 3 Units Up/Down
Materials
- Frame, Brick
- Foundation: Block
- Roof: Shingle,Rubber
Condition
- Year built: 1900
Utilities & green energy
- Electric: 100 Amp Service
- Sewer: Public Sewer
- Water: Public
- Utilities for property: for Gas Range
Community & HOA
Location
- Region: Lawrence
Financial & listing details
- Price per square foot: $239/sqft
- Tax assessed value: $733,600
- Annual tax amount: $820,600
- Date on market: 10/1/2026
- Total actual rent: 0
Estimated market value
$894,900
$850,000 - $940,000
$1,949/mo
Price history
| Date | Event | Price |
|---|---|---|
| 10/19/2026 | Price change | $875,000-2.7%$239/sqft |
Source: MLS PIN #73585624 Report a problem | ||
| 10/1/2026 | Listed for sale | $899,000+65%$246/sqft |
Source: MLS PIN #73585624 Report a problem | ||
| 7/26/2021 | Sold | $545,000+2.8%$149/sqft |
Source: Public Record Report a problem | ||
| 6/8/2021 | Pending sale | $529,900$145/sqft |
Source: MLS PIN #72833788 Report a problem | ||
| 5/26/2021 | Contingent | $529,900$145/sqft |
Source: MLS PIN #72833788 Report a problem | ||
| 5/19/2021 | Listed for sale | $529,900+39.4%$145/sqft |
Source: MLS PIN #72833788 Report a problem | ||
| 2/14/2020 | Sold | $380,000+1.3%$104/sqft |
Source: Public Record Report a problem | ||
| 12/28/2019 | Pending sale | $375,000$103/sqft |
Source: Century 21 North East #72602230 Report a problem | ||
| 12/23/2019 | Listed for sale | $375,000+80.6%$103/sqft |
Source: Century 21 North East #72602230 Report a problem | ||
| 1/28/2009 | Sold | $207,664$57/sqft |
Source: Public Record Report a problem | ||
| 7/16/2008 | Sold | $207,664+112.1%$57/sqft |
Source: Public Record Report a problem | ||
| 5/28/2008 | Price change | $97,900-31%$27/sqft |
Source: MLS Property Information Network #70675202 Report a problem | ||
| 3/7/2008 | Price change | $141,900-11.3%$39/sqft |
Source: MLS Property Information Network Report a problem | ||
| 2/21/2008 | Listed for sale | $159,900-30.5%$44/sqft |
Source: MLS Property Information Network Report a problem | ||
| 2/22/2006 | Sold | $230,000+820%$63/sqft |
Source: Public Record Report a problem | ||
| 12/13/1993 | Sold | $25,000-84%$7/sqft |
Source: Public Record Report a problem | ||
| 6/19/1989 | Sold | $156,000$43/sqft |
Source: Public Record Report a problem | ||
Public tax history
| Year | Property taxes | Tax assessment |
|---|---|---|
| 2025 | $5,463 +2.4% | $620,800 +7.7% |
| 2024 | $5,334 +2.3% | $576,600 +12.4% |
| 2023 | $5,213 | $513,100 |
| 2022 | $5,213 +14.2% | $513,100 +37.9% |
| 2021 | $4,566 +2.6% | $372,100 +3.9% |
| 2020 | $4,451 +3.4% | $358,100 +13.8% |
| 2019 | $4,304 +5.5% | $314,600 +10.4% |
| 2018 | $4,081 +11.2% | $285,000 +19.1% |
| 2017 | $3,671 +2.8% | $239,300 +3.9% |
| 2016 | $3,572 +4.3% | $230,300 +1.7% |
| 2015 | $3,425 +6% | $226,500 +9.5% |
| 2014 | $3,230 +16.6% | $206,900 +12.7% |
| 2013 | $2,769 +7.6% | $183,600 +1.9% |
| 2012 | $2,574 +12.4% | $180,100 +5.8% |
| 2011 | $2,291 -7.8% | $170,300 -13.9% |
| 2010 | $2,485 -16% | $197,700 -28.5% |
| 2009 | $2,960 +0.8% | $276,600 -5.7% |
| 2008 | $2,937 +5.3% | $293,400 -2.9% |
| 2007 | $2,788 +9.2% | $302,100 +4.8% |
| 2006 | $2,553 +3.2% | $288,200 +13% |
| 2005 | $2,474 +38.3% | $255,100 +71.7% |
| 2004 | $1,789 -0.3% | $148,600 |
| 2003 | $1,794 +69.1% | $148,600 +117.6% |
| 2002 | $1,061 -0.8% | $68,300 |
| 2000 | $1,070 -4% | $68,300 +18.4% |
| 1997 | $1,115 | $57,690 |
Find assessor info on the county website
Monthly payment
Est. payment
Payment breakdown
Explore the cost of this home by adjusting the details. Changes won't be saved.Climate risks
Neighborhood: 01840


Similar homes
- $865,7409 bd3 ba3.3k sqft180 S Union St, Lawrence, MA 01843For Sale
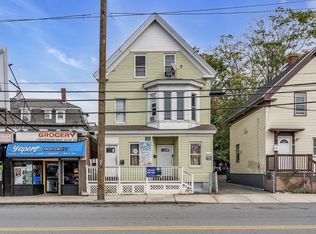 MLS ID #73595602, Zolgalys Sanchez, View Real Estate Group. MLS PIN
- $970,0009 bd3 ba4.6k sqft903-905 Essex St, Lawrence, MA 01841For Sale
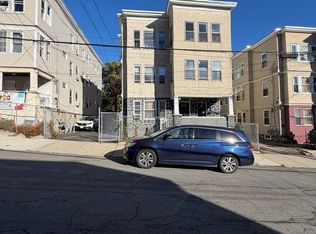 MLS ID #73596247, Martin Alcantara, eXp Realty LLC. MLS PIN
- $979,9998 bd3 ba3k sqft248-250 Bailey St, Lawrence, MA 01843For Sale
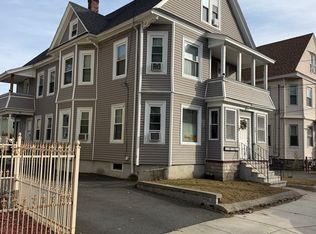 MLS ID #73594040, Rafael Vega, The Guselli Agency, Inc.. MLS PIN
- $750,0006 bd2 ba3k sqft16 Berkeley St, Lawrence, MA 01841For Sale
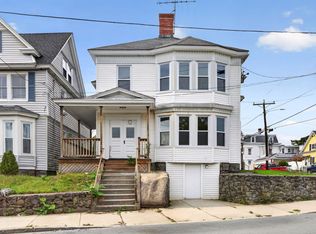 MLS ID #73586884, Zolgalys Sanchez, View Real Estate Group. MLS PIN
