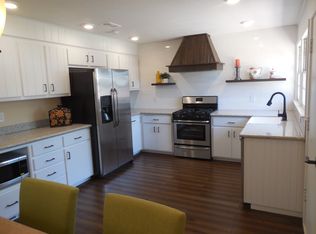
Fabulous 1% rule investment property! 3/2 brick home located in Maedgen, just a short drive to the Medical District and Texas Tech. Currently rented at $1,325 until 2027, 4208 39th St will make a tremendous addition to any investors portfolio. Featuring a fireplace, beautiful formica counters, carport, and a large backyard, this house has provided it's tenants a comfortable for many years. Whether you're a first time investors, or just looking to add, you won't want to miss this chance to call this property your own!
Pending
$132,500
4208 39th St, Lubbock, TX 79413
3beds
1,611sqft
Single Family Residence, Residential
Built in 1957
8,276 Square Feet Lot
$-- Zestimate®
$82/sqft
$-- HOA
What's special
Large backyardBeautiful formica counters
- 42 days
- 114
- 10
Zillow last checked:
Listing updated:
Listed by:
Clay Grossman TREC #0812815 806-828-0736,
Wise Cardinal Realty,
David Bruegel TREC #0665853 806-782-5303,
Wise Cardinal Realty
Source: LBMLS,MLS#: 202613602
Facts & features
Interior
Bedrooms & bathrooms
- Bedrooms: 3
- Bathrooms: 2
- Full bathrooms: 2
Heating
- Central
Cooling
- Central Air
Features
- Ceiling Fan(s), Formica Counters
- Number of fireplaces: 1
Interior area
- Total structure area: 1,611
- Total interior livable area: 1,611 sqft
- Finished area above ground: 1,611
Property
Parking
- Parking features: Carport
Features
- Exterior features: None
Lot
- Size: 8,276 Square Feet
Details
- Parcel number: R119098
Construction
Type & style
- Home type: SingleFamily
- Property subtype: Single Family Residence, Residential
Materials
- Brick
- Foundation: Slab
- Roof: Composition
Condition
- Updated/Remodeled
- New construction: No
- Year built: 1957
Community & HOA
Community
- Security: None
Location
- Region: Lubbock
Financial & listing details
- Price per square foot: $82/sqft
- Tax assessed value: $157,005
- Annual tax amount: $2,778
- Date on market: 10/2/2026
- Cumulative days on market: 42 days
- Listing terms: Cash,Conventional
- Road surface type: Paved
Estimated market value
Not available
Estimated sales range
Not available
$1,645/mo
Price history
| Date | Event | Price |
|---|---|---|
| 10/21/2026 | Pending sale | $132,500$82/sqft |
Source:  LBMLS #202613602 Report a problem | ||
| 10/2/2026 | Listed for sale | $132,500-14.1%$82/sqft |
Source: LBMLS #202613602 Report a problem | ||
| 10/22/2025 | Listing removed | $1,325$1/sqft |
Source: Zillow Rentals Report a problem | ||
| 9/25/2025 | Listed for rent | $1,325+1.9%$1/sqft |
Source: Zillow Rentals Report a problem | ||
| 7/26/2023 | Listing removed | -- |
Source: Zillow Rentals Report a problem | ||
| 7/21/2023 | Listed for rent | $1,300$1/sqft |
Source: Zillow Rentals Report a problem | ||
| 1/4/2023 | Listing removed | -- |
Source: Zillow Rentals Report a problem | ||
| 12/7/2022 | Listed for rent | $1,300$1/sqft |
Source: Zillow Rentals Report a problem | ||
| 11/1/2021 | Listing removed | -- |
Source: LBMLS #202105228 Report a problem | ||
| 6/30/2021 | Price change | $154,300+4.3%$96/sqft |
Source: LBMLS #202105228 Report a problem | ||
| 5/24/2021 | Listed for sale | $148,000$92/sqft |
Source: LBMLS #202105228 Report a problem | ||
Public tax history
| Year | Property taxes | Tax assessment |
|---|---|---|
| 2026 | -- | $157,005 |
| 2025 | $2,778 -4.2% | $157,005 -1.7% |
| 2024 | $2,901 +1.9% | $159,752 +4.3% |
| 2023 | $2,846 -6.9% | $153,131 +1.3% |
| 2022 | $3,059 +15.5% | $151,092 +21.3% |
| 2021 | $2,649 +43.8% | $124,528 +44.8% |
| 2020 | $1,842 +393.7% | $86,000 -23.1% |
| 2019 | $373 +1.1% | $111,867 -1.4% |
| 2018 | $369 | $113,449 +8.3% |
| 2017 | $369 -10.1% | $104,744 +5.6% |
| 2016 | $411 | $99,204 +6.5% |
| 2015 | $411 | $93,112 +0.6% |
| 2014 | $411 | $92,598 |
| 2013 | -- | $92,598 |
| 2012 | -- | $92,598 |
| 2011 | -- | $92,598 +8% |
| 2010 | -- | $85,762 |
| 2009 | -- | $85,762 |
| 2008 | -- | $85,762 +7.6% |
| 2007 | -- | $79,679 +9.7% |
| 2006 | -- | $72,624 +0.6% |
| 2005 | -- | $72,184 +6.5% |
| 2004 | -- | $67,774 +4.8% |
| 2003 | -- | $64,687 +2.6% |
| 2002 | $340 +16.7% | $63,054 +16% |
| 2001 | $291 +0.1% | $54,349 |
| 2000 | $291 | $54,349 |
Find assessor info on the county website
Monthly payment
Est. payment
Payment breakdown
Explore the cost of this home by adjusting the details. Changes won't be saved.Climate risks
Neighborhood: Maedgen Area
Similar homes
- $110,0002 bd2 ba1.5k sqft3503 39th St, Lubbock, TX 79413For Sale
 MLS ID #202615099, Tiffany Soto, Taylor Reid Realty. LBMLS
- $156,9003 bd2 ba1.4k sqft4205 39th St, Lubbock, TX 79413For Sale
 MLS ID #202611693, Tristan Thoma, Rent-LBK Managed by BOLDst. LBMLS
- $149,0003 bd2 ba1.5k sqft3819 33rd St, Lubbock, TX 79410For Sale
 MLS ID #202613799, Freddie Marmolejo, Texas Premier Realty. LBMLS
- $140,0004 bd2 ba1.6k sqft2718 62nd St, Lubbock, TX 79413For Sale
 MLS ID #202612903, Clay Grossman, Wise Cardinal Realty. LBMLS
