Welcome to this beautifully remodeled Lancaster home featuring 5 spacious bedrooms, 2 bathrooms, and an expansive lot with endless possibilities! Enjoy the updated kitchen and bathrooms, thoughtfully refreshed to offer modern style and everyday comfort. With generous living space and a large lot perfect for outdoor entertaining, gardening, or creating your dream backyard, this property offers incredible versatility and room to grow. Whether you're looking for a place to call home or an opportunity to make the most of a spacious property, this is one you won't want to miss!
For sale
$499,000
42215 52nd St W, Lancaster, CA 93536
5beds
1,844sqft
Residential
Built in 1956
0.27 Acres Lot
$498,300 Zestimate®
$271/sqft
$-- HOA
What's special
- 3 days
- 330
- 36
Zillow last checked:
Listing updated:
Listed by:
Armen Gyurdzhyan DRE # 01925918 818-304-4582,
JohnHart Corp. 818-246-1099
Source: CLAW,MLS#: 26102856
Facts & features
Interior
Bedrooms & bathrooms
- Bedrooms: 5
- Bathrooms: 2
- Full bathrooms: 2
Heating
- Central
Cooling
- Central Air
Appliances
- Included: Microwave, Range/Oven
- Laundry: None, Gas Dryer Hookup
Features
- Flooring: Hardwood
- Has fireplace: No
- Fireplace features: None
Interior area
- Total structure area: 1,844
- Total interior livable area: 1,844 sqft
Property
Parking
- Total spaces: 2
- Parking features: Attached
- Has attached garage: Yes
Features
- Levels: One
- Pool features: None
- Spa features: None
- Has view: Yes
- View description: Trees/Woods
Lot
- Size: 0.27 Acres
Details
- Additional structures: None
- Parcel number: 3102012017
- Zoning: LCR17500*
- Special conditions: Standard
Construction
Type & style
- Home type: SingleFamily
- Architectural style: Traditional
- Property subtype: Residential
- Attached to another structure: Yes
Condition
- Year built: 1956
Community & HOA
HOA
- Has HOA: No
Location
- Region: Lancaster
Financial & listing details
- Price per square foot: $271/sqft
- Tax assessed value: $499,391
- Date on market: 10/22/2026
Estimated market value
$498,300
$473,000 - $523,000
$3,338/mo
Price history
| Date | Event | Price |
|---|---|---|
| 10/22/2026 | Listed for sale | $499,000+4%$271/sqft |
Source:  CLAW #26102856 Report a problem | ||
| 1/21/2026 | Listing removed | $3,315$2/sqft |
Source: Zillow Rentals Report a problem | ||
| 12/20/2025 | Listed for rent | $3,315+0.5%$2/sqft |
Source: Zillow Rentals Report a problem | ||
| 12/20/2025 | Listing removed | $3,300$2/sqft |
Source: Zillow Rentals Report a problem | ||
| 11/13/2025 | Listed for rent | $3,300-1.5%$2/sqft |
Source: Zillow Rentals Report a problem | ||
| 11/12/2025 | Listing removed | $3,350$2/sqft |
Source: Zillow Rentals Report a problem | ||
| 11/5/2025 | Listed for rent | $3,350-0.1%$2/sqft |
Source: Zillow Rentals Report a problem | ||
| 11/4/2025 | Listing removed | $3,354$2/sqft |
Source: Zillow Rentals Report a problem | ||
| 9/12/2025 | Listed for rent | $3,354-4.2%$2/sqft |
Source: Zillow Rentals Report a problem | ||
| 9/9/2024 | Listing removed | $3,500$2/sqft |
Source: Zillow Rentals Report a problem | ||
| 6/28/2024 | Listed for rent | $3,500$2/sqft |
Source: Zillow Rentals Report a problem | ||
| 6/28/2024 | Listing removed | -- |
Source: Zillow Rentals Report a problem | ||
| 6/22/2024 | Listed for rent | $3,500-2.8%$2/sqft |
Source: Zillow Rentals Report a problem | ||
| 6/21/2024 | Listing removed | -- |
Source: Zillow Rentals Report a problem | ||
| 6/11/2024 | Listed for rent | $3,600$2/sqft |
Source: Zillow Rentals Report a problem | ||
| 6/11/2024 | Listing removed | -- |
Source: Zillow Rentals Report a problem | ||
| 5/22/2024 | Price change | $3,600-10%$2/sqft |
Source: Zillow Rentals Report a problem | ||
| 4/26/2024 | Listed for rent | $4,000$2/sqft |
Source: Zillow Rentals Report a problem | ||
| 3/13/2024 | Sold | $480,000+1.1%$260/sqft |
Source:  CRMLS #SR23184463 Report a problem | ||
| 1/3/2024 | Pending sale | $475,000$258/sqft |
Source: CRMLS #SR23184463 Report a problem | ||
| 10/19/2023 | Price change | $475,000-5%$258/sqft |
Source: CRMLS #SR23184463 Report a problem | ||
| 10/4/2023 | Listed for sale | $499,9990%$271/sqft |
Source: CRMLS #SR23184463 Report a problem | ||
| 3/3/2022 | Sold | $500,000+25.2%$271/sqft |
Source: Public Record Report a problem | ||
| 6/21/2021 | Sold | $399,500+47.4%$217/sqft |
Source: Public Record Report a problem | ||
| 7/3/2018 | Sold | $271,000-3.2%$147/sqft |
Source:  GAVAR #18004141 Report a problem | ||
| 6/26/2018 | Pending sale | $280,000$152/sqft |
Source: HomeBased Realty #18004141 Report a problem | ||
| 4/20/2018 | Listed for sale | $280,000+75%$152/sqft |
Source: HomeBased Realty #18004141 Report a problem | ||
| 11/8/2009 | Listing removed | $160,000+3.2%$87/sqft |
Source: Remax All Pro #271418 Report a problem | ||
| 11/4/2009 | Sold | $155,000$84/sqft |
Source: Public Record Report a problem | ||
Public tax history
| Year | Property taxes | Tax assessment |
|---|---|---|
| 2026 | -- | $499,391 +2% |
| 2025 | $6,760 -3.4% | $489,600 -5.9% |
| 2024 | $6,997 +0.8% | $520,199 +2% |
| 2023 | $6,940 +1.6% | $510,000 +25.2% |
| 2022 | $6,831 +21.6% | $407,490 +30.3% |
| 2021 | $5,616 +24.4% | $312,705 +13.1% |
| 2020 | $4,516 +9.8% | $276,420 +2% |
| 2019 | $4,114 +226.7% | $271,000 +54.1% |
| 2018 | $1,259 | $175,834 +2% |
| 2017 | $1,259 -0.3% | $172,387 +2% |
| 2016 | $1,263 +3.3% | $169,007 +1.5% |
| 2015 | $1,223 +0.3% | $166,470 +2% |
| 2014 | $1,219 | $163,210 +6.7% |
| 2012 | -- | $153,000 -2% |
| 2011 | -- | $156,166 +0.8% |
| 2010 | -- | $155,000 -20.7% |
| 2009 | -- | $195,400 -4.7% |
| 2008 | -- | $205,093 +13% |
| 2007 | -- | $181,465 +2% |
| 2006 | -- | $177,908 |
| 2005 | -- | $177,908 +249.1% |
| 2004 | -- | $50,965 +1.9% |
| 2003 | -- | $50,032 -49.2% |
| 2002 | -- | $98,421 +108.7% |
| 2000 | -- | $47,150 |
Find assessor info on the county website
Monthly payment
Est. payment
Payment breakdown
Explore the cost of this home by adjusting the details. Changes won't be saved.Climate risks
Neighborhood: 93536
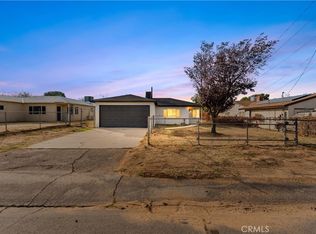
Similar homes
- $390,0004 bd2 ba1.7k sqft5226 W Avenue L10, Lancaster, CA 93536For Sale
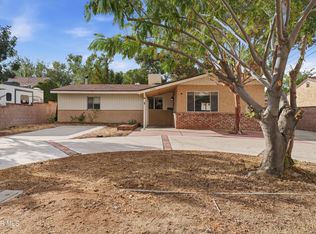 MLS ID #26008135, Andrea P Castaneda. GAVAR
- $489,9993 bd2 ba1.4k sqft42515 Carriage Way, Quartz Hill, CA 93536For Sale
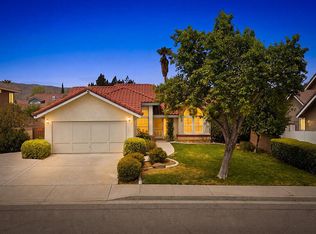 MLS ID #26008131, Tifany George. GAVAR
- $510,0003 bd2 ba1.2k sqft6314 Almond Valley Way, Quartz Hill, CA 93536For Sale
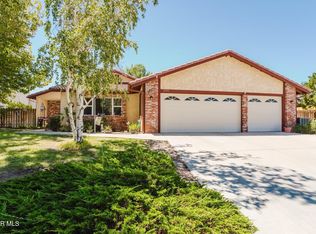 MLS ID #26008095, Celeste Montoya. GAVAR
- $525,0004 bd2 ba2k sqft43037 Sachs Dr, Lancaster, CA 93536For Sale
 MLS ID #26008030, Darlene Sandoval. GAVAR
