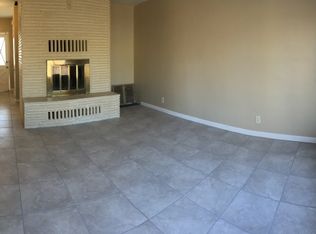
Currently a recently remodeled 3 bedroom 2 bath main house with a seperate studio unit..permits unknown... great upside potential..
Quiet area... great potential...live in one, rent out the other...or add to your investment portfolio.....
Pending
Listed by: Keller Williams North Valley
$300,000
44306 3rd St E, Lancaster, CA 93535
4beds
1,100sqft
Single Family Residence
Built in 1952
6,069 Square Feet Lot
$490,000 Zestimate®
$273/sqft
$-- HOA
What's special
- 442 days |
- 40 |
- 1 |
Zillow last checked:
Listing updated:
Listed by:
Ellie Thompson DRE #00922095 etagent@yahoo.com,
Keller Williams North Valley
Source: CRMLS,MLS#: SR24248261 Originating MLS: California Regional MLS
Facts & features
Interior
Bedrooms & bathrooms
- Bedrooms: 4
- Bathrooms: 3
- Full bathrooms: 3
- Main level bathrooms: 3
- Main level bedrooms: 4
Rooms
- Room types: Bedroom
Bedroom
- Features: All Bedrooms Down
Cooling
- Central Air
Appliances
- Laundry: Electric Dryer Hookup, Gas Dryer Hookup
Features
- All Bedrooms Down
- Has fireplace: No
- Fireplace features: None
- Common walls with other units/homes: No Common Walls
Interior area
- Total interior livable area: 1,100 sqft
Property
Features
- Levels: One
- Stories: 1
- Entry location: front
- Pool features: None
- Has view: Yes
- View description: None
Lot
- Size: 6,069 Square Feet
- Features: 0-1 Unit/Acre
Details
- Parcel number: 3141011014
- Zoning: LRR16500*
- Special conditions: Short Sale
Construction
Type & style
- Home type: SingleFamily
- Property subtype: Single Family Residence
Condition
- New construction: No
- Year built: 1952
Utilities & green energy
- Sewer: Public Sewer
- Water: Public
Community & HOA
Community
- Features: Curbs, Gutter(s), Street Lights, Sidewalks
Location
- Region: Lancaster
Financial & listing details
- Price per square foot: $273/sqft
- Tax assessed value: $389,900
- Annual tax amount: $6,115
- Date on market: 12/11/2024
- Cumulative days on market: 442 days
- Listing terms: Subject To Other
Foreclosure details
Estimated market value
$490,000
$466,000 - $515,000
$3,023/mo
Price history
| Date | Event | Price |
|---|---|---|
| 5/29/2025 | Pending sale | $300,000$273/sqft |
Source: | ||
| 4/14/2025 | Contingent | $300,000$273/sqft |
Source: | ||
| 2/25/2025 | Pending sale | $300,000$273/sqft |
Source: | ||
| 1/30/2025 | Contingent | $300,000$273/sqft |
Source: | ||
| 12/12/2024 | Listed for sale | $300,000-47.8%$273/sqft |
Source: | ||
| 10/29/2024 | Listing removed | $2,800$3/sqft |
Source: Zillow Rentals Report a problem | ||
| 10/3/2024 | Listed for rent | $2,800$3/sqft |
Source: Zillow Rentals Report a problem | ||
| 10/3/2024 | Listing removed | $2,800$3/sqft |
Source: CRMLS #SR24147870 Report a problem | ||
| 9/18/2024 | Price change | $2,800-9.7%$3/sqft |
Source: CRMLS #SR24147870 Report a problem | ||
| 8/9/2024 | Listed for rent | $3,100+10.7%$3/sqft |
Source: CRMLS #SR24147870 Report a problem | ||
| 8/8/2024 | Listing removed | -- |
Source: Zillow Rentals Report a problem | ||
| 7/6/2024 | Listed for rent | $2,800$3/sqft |
Source: Zillow Rentals Report a problem | ||
| 6/20/2024 | Listing removed | -- |
Source: Zillow Rentals Report a problem | ||
| 5/7/2024 | Listed for rent | $2,800+212.8%$3/sqft |
Source: Zillow Rentals Report a problem | ||
| 4/30/2024 | Sold | $575,000$523/sqft |
Source: | ||
| 3/16/2024 | Pending sale | $575,000+134.7%$523/sqft |
Source: | ||
| 9/29/2023 | Sold | $245,000+113%$223/sqft |
Source: Public Record Report a problem | ||
| 4/20/2016 | Sold | $115,000-4.2%$105/sqft |
Source: | ||
| 4/5/2016 | Pending sale | $120,000$109/sqft |
Source: CENTURY 21 Yarrow & Associates Realtors #16002031 Report a problem | ||
| 3/17/2016 | Price change | $120,000-11.1%$109/sqft |
Source: CENTURY 21 Yarrow & Associates Realtors #16002031 Report a problem | ||
| 3/2/2016 | Listed for sale | $135,000+132.8%$123/sqft |
Source: CENTURY 21 Yarrow & Associates Realtors #16002031 Report a problem | ||
| 5/7/2014 | Listing removed | $895$1/sqft |
Source: Postlets Report a problem | ||
| 4/6/2014 | Listed for rent | $895$1/sqft |
Source: Postlets Report a problem | ||
| 4/27/2010 | Sold | $58,000+5.6%$53/sqft |
Source: Public Record Report a problem | ||
| 1/14/2010 | Listed for sale | $54,900-68.2%$50/sqft |
Source: foreclosure.com Report a problem | ||
| 1/7/2010 | Sold | $172,743+23.4%$157/sqft |
Source: Public Record Report a problem | ||
| 7/15/2004 | Sold | $140,000+50.5%$127/sqft |
Source: Public Record Report a problem | ||
| 3/3/2004 | Sold | $93,000+12%$85/sqft |
Source: Public Record Report a problem | ||
| 10/19/2001 | Sold | $83,000+23.9%$75/sqft |
Source: Public Record Report a problem | ||
| 8/22/1997 | Sold | $67,000$61/sqft |
Source: Public Record Report a problem | ||
Public tax history
| Year | Property taxes | Tax assessment |
|---|---|---|
| 2025 | $6,115 +42.7% | $389,900 +59.1% |
| 2024 | $4,285 +48.5% | $245,000 +87.2% |
| 2023 | $2,885 +6.7% | $130,845 +2% |
| 2022 | $2,703 +16.1% | $128,280 +2% |
| 2021 | $2,328 +1% | $125,765 +1% |
| 2020 | $2,305 | $124,477 +2% |
| 2019 | $2,305 +3.4% | $122,037 +2% |
| 2018 | $2,229 | $119,645 +2% |
| 2017 | $2,229 +1% | $117,300 +83.5% |
| 2016 | $2,206 +52.9% | $63,911 +1.5% |
| 2015 | $1,443 0% | $62,952 +2% |
| 2014 | $1,443 | $61,720 +2.5% |
| 2012 | -- | $60,238 +2% |
| 2011 | -- | $59,058 +22.3% |
| 2010 | -- | $48,300 -41.2% |
| 2009 | -- | $82,200 -56.4% |
| 2008 | -- | $188,600 -10.3% |
| 2007 | -- | $210,160 +2% |
| 2006 | -- | $206,040 +55.4% |
| 2005 | -- | $132,600 +53.9% |
| 2004 | -- | $86,136 +1.9% |
| 2003 | -- | $84,558 +2% |
| 2002 | -- | $82,900 +86.9% |
| 2000 | -- | $44,359 |
Find assessor info on the county website
Monthly payment
Est. payment$--/mo
Payment breakdown
Explore the cost of this home by adjusting the details. Changes won't be saved.All calculations are estimates and provided by Zillow, Inc. for informational purposes only. Actual amounts may vary.
HOA fees may include property taxes on listings classified as Co-Ops. Contact the listing agent and/or owner for fee details.
Mortgage interest rates are dependent on a number of factors, including credit score, down payment, and repayment length. Interest rate data provided by Zillow Group Marketplace, Inc. as of 1/1/1970 from various mortgage lenders with which we have lead or other similar arrangements; the Estimated Payment is an average of those rates.
See how much you could borrow to make a competitive offer.
Climate risks
Neighborhood: Joshua
Nearby schools
GreatSchools rating
- 2/10Joshua ElementaryGrades: K-6Distance: 0.5 mi
- 2/10New Vista Middle SchoolGrades: 6-8Distance: 1 mi
- 3/10Antelope Valley High SchoolGrades: 9-12Distance: 0.9 mi
A local agent can set up tours, give advice and negotiate with sellers.


Local buyer's agents are ready to help
- California
- Los Angeles County
- Lancaster
- 93535
- Joshua
- 44306 3rd St E
Nearby cities
Nearby neighborhoods
Nearby zip codes
Other Lancaster Topics
