Excellent Opportunity to own a solid brick 2 flat with finished basement. Featuring a side drive with a rear parking pad. With a little sweat equity you can sit back and watch the appreciation!! Sold completely as is, seller looking for a quick seamless closing. 2nd floor occupied by cash paying tenant, first floor vacant.
New
$179,900
4508 W Maypole Ave, Chicago, IL 60624
5beds
--sqft
Multi Family
Built in 1908
-- sqft lot
$-- Zestimate®
$--/sqft
$-- HOA
What's special
Finished basementSide driveRear parking pad
- 4 days
- 622
- 57
Likely to sell faster than
Zillow last checked:
Listing updated:
Listed by:
Cedrick Hunter, CRB 708-628-2900,
Hunter's Realty, Inc.
Source: MRED as distributed by MLS GRID,MLS#: 12790949
Facts & features
Interior
Bedrooms & bathrooms
- Bedrooms: 5
- Bathrooms: 2
- Full bathrooms: 2
Heating
- Radiator(s)
Features
- Basement: Finished,Partially Finished,Full
Property
Parking
- Total spaces: 2
- Parking features: Yes
Lot
- Size: 3,600 Square Feet
Details
- Parcel number: 16103160330000
- Special conditions: None
Construction
Type & style
- Home type: MultiFamily
- Property subtype: Multi Family
Materials
- Brick
Condition
- New construction: No
- Year built: 1908
Utilities & green energy
- Sewer: Public Sewer
- Water: Lake Michigan
Community & HOA
Location
- Region: Chicago
Financial & listing details
- Tax assessed value: $197,000
- Annual tax amount: $165
- Date on market: 10/21/2026
- Ownership: Fee Simple
Estimated market value
Not available
Estimated sales range
Not available
$2,146/mo
Price history
| Date | Event | Price |
|---|---|---|
| 10/21/2026 | Listed for sale | $179,900 |
Source:  MRED as distributed by MLS GRID #12790949 Report a problem | ||
Public tax history
| Year | Property taxes | Tax assessment |
|---|---|---|
| 2024 | $156 -5.3% | $19,700 +3.7% |
| 2023 | $165 -93.8% | $19,000 |
| 2022 | $2,651 +1578.1% | $19,000 |
| 2021 | $158 -3.1% | $19,000 +52% |
| 2020 | $163 +0.3% | $12,501 -12% |
| 2019 | $163 +1.5% | $14,206 |
| 2018 | $160 -6.6% | $14,206 -20.1% |
| 2017 | $171 -71.3% | $17,777 |
| 2016 | $597 +4% | $17,777 |
| 2015 | $573 +0.9% | $17,777 +6% |
| 2014 | $569 -0.4% | $16,763 |
| 2013 | $571 +6.8% | $16,763 |
| 2012 | $534 -5.4% | $16,763 -17.6% |
| 2011 | $565 -82.9% | $20,350 |
| 2010 | $3,311 +591.3% | $20,350 |
| 2009 | $479 -8.4% | $20,350 -11.7% |
| 2008 | $523 -11.7% | $23,050 |
| 2007 | $592 -5.8% | $23,050 |
| 2006 | $628 -14.9% | $23,050 +49.4% |
| 2005 | $739 -29.8% | $15,430 |
| 2004 | $1,052 +22.5% | $15,430 |
| 2003 | $859 -11.6% | $15,430 +75.1% |
| 2002 | $972 +3.4% | $8,811 |
| 2001 | $940 +37% | $8,811 |
| 2000 | $686 +0% | $8,811 +58.1% |
| 1999 | $686 | $5,572 |
Find assessor info on the county website
Monthly payment
Est. payment
Payment breakdown
Explore the cost of this home by adjusting the details. Changes won't be saved.Climate risks
Neighborhood: West Garfield Park
Nearby schools


Similar homes
- $--6 bd2 ba2.5k sqft1424 S Ridgeway Ave, Chicago, IL 60623Auction
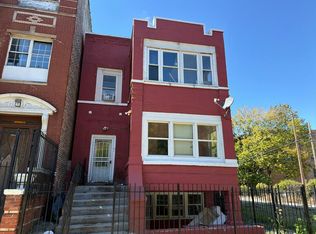 Auction.com 2
- $180,0006 bd3 ba-- sqft1224 S Kolin Ave, Chicago, IL 60623Active
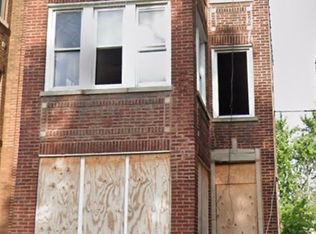 MLS ID #12784879, Nicholas Tsichlis, Midland Realty Group. MRED as distributed by MLS GRID
- $170,0004 bd1 ba1.7k sqft919 N Lorel Ave, Chicago, IL 60651New
 MLS ID #12793073, Allison McGowan, ABR,AHWD,BPOR, @properties Christie's International Real Estate. MRED as distributed by MLS GRID
- $250,0006 bd2 ba-- sqft4425 W Carroll Ave, Chicago, IL 60624Active
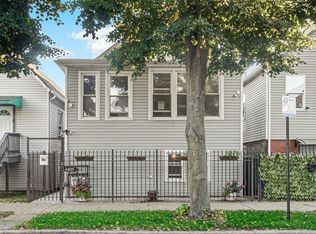 MLS ID #12780558, Ola Sanni, Century 21 S.G.R., Inc.. MRED as distributed by MLS GRID
