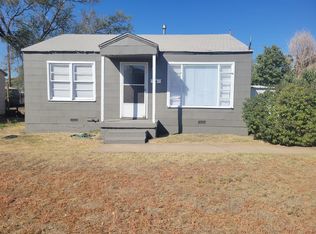
FOR SALE BY OWNER – COMPLETELY UPDATED & MOVE-IN READY!
4618 S. Ong, Amarillo.
This beautifully renovated 2,068 sq. ft. home offers 3 spacious bedrooms and 2 brand-new full bathrooms. Nearly every major component of the home has been updated, making this an exceptional value and worry-free investment.
** New Kitchen
** New Appliances
** New HVAC System
** New Water Heater
** New Windows
** New Sewer Lines
** New Water Lines
** New Natural Gas Line
** New Electrical System
** New Fence
** New Roof (if needed)
With modern updates throughout and quality improvements from top to bottom, this home is ready for its next owner.
Will Pay A Buyers Broker Commission.
For showings Anytime, Chad
806, 676, 6900
For sale by owner
Price cut: $2.5K (6/18)
$217,500
4618 S Ong St, Amarillo, TX 79110
3beds
2,068sqft
SingleFamily
Built in 1953
5,662 Square Feet Lot
$-- Zestimate®
$105/sqft
$-- HOA
What's special
New fenceNew windowsNew water heaterModern updates throughoutNew appliancesNew kitchenNew hvac system
What the owner loves about this home
NEW EVERYTHING!!
- 70 days |
- 798 |
- 38 |
Listed by:
Property Owner (806) 676-6900
Facts & features
Interior
Bedrooms & bathrooms
- Bedrooms: 3
- Bathrooms: 2
- Full bathrooms: 2
Heating
- Forced air, Gas
Cooling
- Central
Appliances
- Included: Dishwasher, Microwave, Range / Oven
Features
- Flooring: Laminate
- Basement: None
Interior area
- Total interior livable area: 2,068 sqft
Property
Features
- Exterior features: Other, Composition
Lot
- Size: 5,662 Square Feet
Details
- Parcel number: R073110012200
Construction
Type & style
- Home type: SingleFamily
Materials
- Roof: Composition
Condition
- New construction: No
- Year built: 1953
Community & HOA
Location
- Region: Amarillo
Financial & listing details
- Price per square foot: $105/sqft
- Tax assessed value: $211,233
- Annual tax amount: $4,068
- Date on market: 4/16/2026
Estimated market value
Not available
Estimated sales range
Not available
$1,502/mo
Price history
| Date | Event | Price |
|---|---|---|
| 6/18/2026 | Price change | $217,500-1.1%$105/sqft |
Source: Owner Report a problem | ||
| 6/10/2026 | Price change | $220,000-2.2%$106/sqft |
Source: Owner Report a problem | ||
| 5/30/2026 | Price change | $224,999-2%$109/sqft |
Source: Owner Report a problem | ||
| 5/26/2026 | Price change | $229,500-2.3%$111/sqft |
Source: Owner Report a problem | ||
| 5/22/2026 | Price change | $234,950-1.7%$114/sqft |
Source: Owner Report a problem | ||
| 4/16/2026 | Listed for sale | $239,000-4.2%$116/sqft |
Source: Owner Report a problem | ||
| 1/19/2026 | Listing removed | -- |
Source: Owner Report a problem | ||
| 10/21/2025 | Listed for sale | $249,500+16%$121/sqft |
Source: Owner Report a problem | ||
| 8/6/2025 | Listing removed | -- |
Source: Owner Report a problem | ||
| 6/23/2025 | Price change | $215,000-2.3%$104/sqft |
Source: Owner Report a problem | ||
| 6/12/2025 | Price change | $220,000-3.7%$106/sqft |
Source: | ||
| 6/5/2025 | Price change | $228,500-2.8%$110/sqft |
Source: | ||
| 5/31/2025 | Price change | $235,000-3.9%$114/sqft |
Source: | ||
| 5/27/2025 | Price change | $244,500-1%$118/sqft |
Source: | ||
| 5/22/2025 | Price change | $246,950-1.2%$119/sqft |
Source: | ||
| 5/16/2025 | Price change | $249,950-1.6%$121/sqft |
Source: | ||
| 5/2/2025 | Price change | $254,000-4.2%$123/sqft |
Source: | ||
| 4/17/2025 | Price change | $265,000+3.9%$128/sqft |
Source: | ||
| 3/11/2025 | Price change | $255,000-3.8%$123/sqft |
Source: Owner Report a problem | ||
| 3/2/2025 | Listed for sale | $265,000$128/sqft |
Source: Owner Report a problem | ||
| 1/21/2025 | Listing removed | $265,000$128/sqft |
Source: | ||
| 12/18/2024 | Listed for sale | $265,000$128/sqft |
Source: | ||
Public tax history
| Year | Property taxes | Tax assessment |
|---|---|---|
| 2025 | $4,068 -1.7% | $211,233 -3.6% |
| 2024 | $4,140 +5.5% | $219,025 +8.5% |
| 2023 | $3,923 +0.2% | $201,820 +10.1% |
| 2022 | $3,914 +28.6% | $183,249 +35.7% |
| 2021 | $3,043 | $135,021 +2.6% |
| 2020 | -- | $131,655 +23% |
| 2019 | $2,391 +153% | $107,061 |
| 2018 | $945 +1.4% | $107,061 +5.2% |
| 2017 | $932 0% | $101,798 +8.1% |
| 2016 | $932 -11.3% | $94,206 |
| 2015 | $1,051 | $94,206 +2.6% |
| 2014 | $1,051 | $91,818 -4% |
| 2013 | -- | $95,675 |
| 2012 | -- | $95,675 +9.8% |
| 2011 | -- | $87,151 |
| 2010 | -- | $87,151 |
| 2009 | -- | $87,151 |
| 2008 | -- | -- |
| 2007 | -- | -- |
| 2006 | -- | -- |
| 2005 | -- | -- |
| 2004 | -- | -- |
| 2003 | -- | -- |
| 2002 | -- | $57,510 |
| 2001 | -- | $57,510 |
Find assessor info on the county website
Monthly payment
Est. payment$--/mo
Payment breakdown
Explore the cost of this home by adjusting the details. Changes won't be saved.All calculations are estimates and provided by Zillow, Inc. for informational purposes only. Actual amounts may vary.
HOA fees may include property taxes on listings classified as Co-Ops. Contact the listing agent and/or owner for fee details.
Mortgage interest rates are dependent on a number of factors, including credit score, down payment, and repayment length. Interest rate data provided by Zillow Group Marketplace, Inc. as of 1/1/1970 from various mortgage lenders with which we have lead or other similar arrangements; the Estimated Payment is an average of those rates.
See how much you could borrow to make a competitive offer.
Climate risks
Neighborhood: 79110
Nearby schools
GreatSchools rating
- 8/10South Lawn Elementary SchoolGrades: PK-5Distance: 0.4 mi
- 4/10Fannin Middle SchoolGrades: 6-8Distance: 0.6 mi
- 3/10Caprock High SchoolGrades: 9-12Distance: 3 mi
A local agent can set up tours, give advice and negotiate with sellers.
A local lender can help you make sure your offer is ready when you are.


- Texas
- Randall County
- Amarillo
- 79110
- 4618 S Ong St
Nearby cities
Nearby zip codes
Other Amarillo Topics
