This 2588 square foot single family home has 4 bedrooms and 3.0 bathrooms. This home is located at 462 Quail Run Cir, Tracy, CA 95377.
Pre-foreclosure
Street View
Est. $788,500
462 Quail Run Cir, Tracy, CA 95377
4beds
2,588sqft
SingleFamily
Built in 1999
7,187 Square Feet Lot
$788,500 Zestimate®
$305/sqft
$-- HOA
Overview
- 146 days
- 46
- 0
Facts & features
Interior
Bedrooms & bathrooms
- Bedrooms: 4
- Bathrooms: 3
- Full bathrooms: 3
Heating
- Other
Cooling
- Central
Appliances
- Included: Dishwasher, Garbage disposal, Microwave, Range / Oven
Features
- Flooring: Tile, Hardwood, Laminate
- Has fireplace: Yes
Interior area
- Total interior livable area: 2,588 sqft
Property
Parking
- Total spaces: 3
Features
- Exterior features: Stucco
Lot
- Size: 7,187 Square Feet
Details
- Parcel number: 248330170000
Construction
Type & style
- Home type: SingleFamily
Materials
- wood frame
Condition
- Year built: 1999
Community & HOA
Location
- Region: Tracy
Financial & listing details
- Price per square foot: $305/sqft
- Tax assessed value: $609,301
Foreclosure details
Estimated market value
$788,500
$749,000 - $828,000
$3,611/mo
Price history
| Date | Event | Price |
|---|---|---|
| 10/9/2024 | Listing removed | $819,888$317/sqft |
Source:  bridgeMLS/CCAR/Bay East AOR #41074574 Report a problem | ||
| 10/2/2024 | Listed for sale | $819,888-4.7%$317/sqft |
Source: bridgeMLS/CCAR/Bay East AOR #41074574 Report a problem | ||
| 10/1/2022 | Listing removed | -- |
Source: bridgeMLS/CCAR/Bay East AOR #40999798 Report a problem | ||
| 8/11/2022 | Price change | $860,000-1.7%$332/sqft |
Source: bridgeMLS/CCAR/Bay East AOR #40999798 Report a problem | ||
| 6/30/2022 | Listed for sale | $875,000+66.7%$338/sqft |
Source: bridgeMLS/CCAR/Bay East AOR #40999798 Report a problem | ||
| 1/12/2018 | Sold | $525,000+64.1%$203/sqft |
Source: Public Record Report a problem | ||
| 1/22/2010 | Sold | $320,000-57.3%$124/sqft |
Source: MetroList Services of CA #90095224 Report a problem | ||
| 11/3/2005 | Sold | $750,000+149.2%$290/sqft |
Source:  Bay East AOR #40113850 Report a problem | ||
| 7/19/1999 | Sold | $301,000$116/sqft |
Source: Public Record Report a problem | ||
Public tax history
| Year | Property taxes | Tax assessment |
|---|---|---|
| 2026 | -- | $609,301 +2% |
| 2025 | $6,473 +3.2% | $597,355 +2% |
| 2024 | $6,274 +1.8% | $585,643 +2% |
| 2023 | $6,163 +1.8% | $574,161 +2% |
| 2022 | $6,052 +1.5% | $562,904 +2% |
| 2021 | $5,962 +0.7% | $551,868 +1% |
| 2020 | $5,919 +2.1% | $546,210 +2% |
| 2019 | $5,799 +36.7% | $535,500 +47.5% |
| 2018 | $4,243 +2.3% | $363,014 +2% |
| 2017 | $4,148 +1.9% | $355,897 +2% |
| 2016 | $4,072 +2% | $348,921 +1.5% |
| 2015 | $3,992 | $343,683 +2% |
| 2014 | $3,992 | $336,953 +0.5% |
| 2013 | -- | $335,433 +7.9% |
| 2012 | -- | $311,000 +3.3% |
| 2011 | -- | $301,000 -5.9% |
| 2010 | -- | $320,000 +4.2% |
| 2009 | -- | $307,000 -39.8% |
| 2008 | -- | $510,000 -24.4% |
| 2007 | -- | $675,000 -10% |
| 2006 | -- | $750,000 +113% |
| 2005 | -- | $352,177 +2% |
| 2004 | -- | $345,273 +1.9% |
| 2003 | -- | $338,945 +4% |
| 2002 | -- | $325,785 |
| 2001 | -- | $325,785 |
Find assessor info on the county website
Monthly payment
Climate risks
Neighborhood: 95377

Similar homes
- $799,0005 bd3 ba2.8k sqft4241 Glenhaven Dr, Tracy, CA 95377For Sale
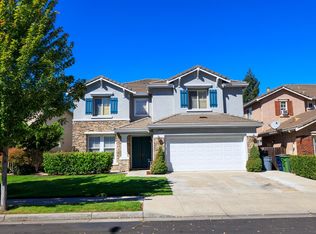 MLS ID #226113158, Rachel Maricich. MetroList Services of CA
- $739,0004 bd2 ba2.3k sqft641 Tracey Jean Ct, Tracy, CA 95377For Sale
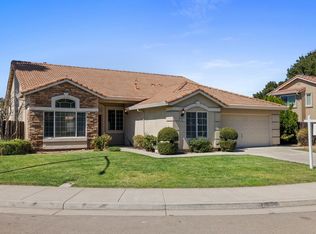 MLS ID #226113179, Jeffrey Aksland. MetroList Services of CA
- $748,0004 bd3 ba2.9k sqft565 Presidio Pl, Tracy, CA 95377For Sale
 MLS ID #41147177, Martin Cai. Bay East AOR
- $667,0004 bd3 ba2k sqft1120 Candlewood Dr, Tracy, CA 95376For Sale
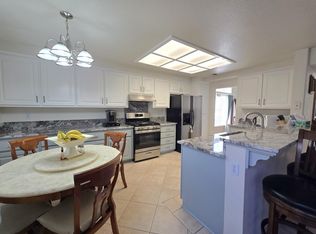 MLS ID #ML82063447, Ramiro Rodriguez. MLSListings Inc
