Contingent upon short sale approval.
Contingent
$99,900
4685 Janis Dr, Columbus, OH 43227
3beds
912sqft
Single Family Residence
Built in 1960
6,098 Square Feet Lot
$-- Zestimate®
$110/sqft
$-- HOA
What's special
- 24 days
- 292
- 28
Zillow last checked:
Listing updated:
Listed by:
Julia A Hupp 614-531-0710,
Red 1 Realty
Source: Columbus and Central Ohio Regional MLS ,MLS#: 226037000
Facts & features
Interior
Bedrooms & bathrooms
- Bedrooms: 3
- Bathrooms: 1
- Full bathrooms: 1
- Main level bedrooms: 3
Heating
- Electric
Cooling
- Central Air
Features
- Common walls with other units/homes: No Common Walls
Interior area
- Total structure area: 912
- Total interior livable area: 912 sqft
Property
Parking
- Parking features: On Street
- Has uncovered spaces: Yes
Features
- Levels: One
- Fencing: Fenced
Lot
- Size: 6,098 Square Feet
Details
- Parcel number: 010106395
- Special conditions: Short Sale,Standard
Construction
Type & style
- Home type: SingleFamily
- Architectural style: Ranch
- Property subtype: Single Family Residence
Materials
- Foundation: Slab
Condition
- New construction: No
- Year built: 1960
Utilities & green energy
- Sewer: Public Sewer
- Water: Public
Community & HOA
Community
- Subdivision: Lea-Wood Gardens
HOA
- Has HOA: No
Location
- Region: Columbus
Financial & listing details
- Price per square foot: $110/sqft
- Tax assessed value: $152,100
- Annual tax amount: $2,856
- Date on market: 9/29/2026
Estimated market value
Not available
Estimated sales range
Not available
Not available
Price history
| Date | Event | Price |
|---|---|---|
| 9/30/2026 | Contingent | $99,900$110/sqft |
Source:  Columbus and Central Ohio Regional MLS #226037000 Report a problem | ||
| 9/29/2026 | Listed for sale | $99,900-20%$110/sqft |
Source: Columbus and Central Ohio Regional MLS #226037000 Report a problem | ||
| 3/18/2025 | Listing removed | $124,900$137/sqft |
Source: Columbus and Central Ohio Regional MLS #225001762 Report a problem | ||
| 1/21/2025 | Pending sale | $124,900$137/sqft |
Source: Columbus and Central Ohio Regional MLS #225001762 Report a problem | ||
| 1/20/2025 | Listed for sale | $124,900-25.7%$137/sqft |
Source: Columbus and Central Ohio Regional MLS #225001762 Report a problem | ||
| 4/10/2023 | Sold | $168,000$184/sqft |
Source: Columbus and Central Ohio Regional MLS #223001831 Report a problem | ||
| 3/9/2023 | Contingent | $168,000$184/sqft |
Source: Columbus and Central Ohio Regional MLS #223001831 Report a problem | ||
| 2/2/2023 | Price change | $168,000-2.3%$184/sqft |
Source: Columbus and Central Ohio Regional MLS #223001831 Report a problem | ||
| 1/24/2023 | Listed for sale | $172,000+97.7%$189/sqft |
Source: Columbus and Central Ohio Regional MLS #223001831 Report a problem | ||
| 2/26/2019 | Sold | $87,000-3.2%$95/sqft |
Source: Columbus and Central Ohio Regional MLS #218045299 Report a problem | ||
| 1/11/2019 | Pending sale | $89,900$99/sqft |
Source: Key Realty #218045299 Report a problem | ||
| 12/27/2018 | Listed for sale | $89,900+239.2%$99/sqft |
Source: Key Realty #218045299 Report a problem | ||
| 12/11/2013 | Sold | $26,500+32.5%$29/sqft |
Source: Columbus and Central Ohio Regional MLS #213039618 Report a problem | ||
| 11/9/2013 | Listed for sale | $19,999-44.4%$22/sqft |
Source: RE/MAX Town Center, LLC #213039618 Report a problem | ||
| 1/23/2013 | Sold | $36,000-50.3%$39/sqft |
Source: Public Record Report a problem | ||
| 11/6/2006 | Sold | $72,500+27.2%$79/sqft |
Source: Public Record Report a problem | ||
| 5/16/2002 | Sold | $57,000$63/sqft |
Source: Public Record Report a problem | ||
Public tax history
| Year | Property taxes | Tax assessment |
|---|---|---|
| 2025 | $2,397 +0.3% | $53,240 |
| 2024 | $2,389 +1.3% | $53,240 |
| 2023 | $2,359 +61.6% | $53,240 +89.2% |
| 2022 | $1,459 -0.2% | $28,140 |
| 2021 | $1,462 -0.1% | $28,140 |
| 2020 | $1,464 +37% | $28,140 +63.7% |
| 2019 | $1,069 +0.2% | $17,190 |
| 2018 | $1,067 | $17,190 |
| 2017 | $1,067 +69.3% | $17,190 +85.2% |
| 2016 | $630 -2.4% | $9,280 |
| 2015 | $646 | $9,280 |
| 2014 | $646 +4.1% | $9,280 -54.3% |
| 2013 | $621 -47.4% | $20,300 |
| 2011 | $1,181 -2.5% | $20,300 -7.2% |
| 2010 | $1,211 +6.4% | $21,875 |
| 2008 | $1,138 +18.7% | $21,875 |
| 2007 | $959 +0.4% | -- |
| 2006 | $955 +4.2% | -- |
| 2005 | $917 -10% | -- |
| 2004 | $1,019 +20.1% | -- |
| 2003 | $848 +0.4% | -- |
| 2002 | $845 +6.8% | -- |
| 2001 | $791 -0.5% | -- |
| 2000 | $795 | -- |
Find assessor info on the county website
Monthly payment
Est. payment
Payment breakdown
Explore the cost of this home by adjusting the details. Changes won't be saved.Climate risks
Neighborhood: Leawood


Similar homes
- $119,9003 bd2 ba976 sqft950 S Byron Ave, Columbus, OH 43227For Sale
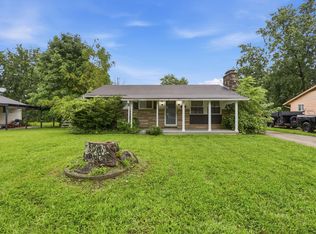
 MLS ID #226031004, Adam D. Woodring, Mainstay Brokerage LLC. Columbus and Central Ohio Regional MLS
- $144,9003 bd1 ba912 sqft1731 Burlington Ave, Columbus, OH 43227For Sale
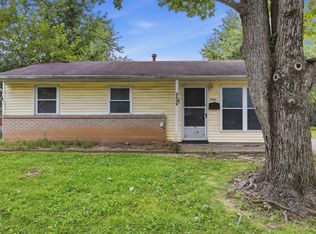 MLS ID #226033468, Michael Mcgee, Mainstay Brokerage LLC. Columbus and Central Ohio Regional MLS
- $--2 bd1 ba1.3k sqft1414 S Champion Ave, Columbus, OH 43206Auction
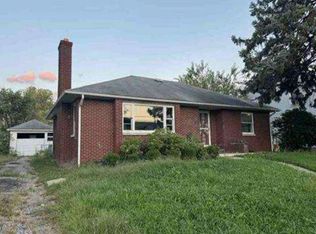 Auction.com 1
- $104,9003 bd1 ba1.2k sqft1927 Gault St, Columbus, OH 43205For Sale
 MLS ID #226027640, Deandra Bryant, Trelora Realty, Inc. Columbus and Central Ohio Regional MLS
- $99,9003 bd2 ba1.1k sqft389 S Warren Ave, Columbus, OH 43204For SaleMLS ID #226038029, Jake Bluvstein, RE/MAX Partners. Columbus and Central Ohio Regional MLS
- $100,0002 bd1 ba672 sqft2425 Vendome Dr S, Columbus, OH 43219For SaleMLS ID #226030769, Anthony L Amos, Reafco. Columbus and Central Ohio Regional MLS
- $107,5003 bd2 ba1.2k sqft691 S Warren Ave, Columbus, OH 43204For SaleMLS ID #226039181, Jacob Bates, Di Lusso Real Estate. Columbus and Central Ohio Regional MLS
- $89,9002 bd1 ba1.1k sqft249 S Burgess Ave, Columbus, OH 43204For SaleMLS ID #226039908, Eric J Cliffel, The Columbus Agents. Columbus and Central Ohio Regional MLS
- $109,9003 bd1 ba1.3k sqft1203 Brookcliff Ave, Columbus, OH 43219For SaleMLS ID #226023496, Matthew Kalogeras, Trelora Realty, Inc. Columbus and Central Ohio Regional MLS
- $109,9002 bd1 ba864 sqft1726 Sunapple Way, Columbus, OH 43232For SaleMLS ID #226036749, William Lindsey, Red 1 Realty. Columbus and Central Ohio Regional MLS
- $100,0003 bd1 ba1.2k sqft1401 Atcheson St, Columbus, OH 43203For SaleMLS ID #225038221, Dana M Milligan, Parker Realty Associates. Columbus and Central Ohio Regional MLS
- $94,9003 bd1 ba1.2k sqft180 Brehl Ave, Columbus, OH 43222For SaleMLS ID #226032438, James E Ross, Red 1 Realty. Columbus and Central Ohio Regional MLS
- $109,9003 bd1 ba1.2k sqft519 Clark Ave, Columbus, OH 43223For SaleMLS ID #226029628, Lisa Pulsfort, Trelora Realty, Inc. Columbus and Central Ohio Regional MLS
- $90,9003 bd1 ba1.3k sqft711 S Highland Ave, Columbus, OH 43223For SaleMLS ID #226023014, Matthew Kalogeras, Trelora Realty, Inc. Columbus and Central Ohio Regional MLS
- $126,9002 bd1 ba960 sqft2538 Nassau Dr #29B, Columbus, OH 43232For SaleMLS ID #226039777, Omar El Mejjaty, Carleton Realty, LLC. Columbus and Central Ohio Regional MLS
- $104,9002 bd1 ba1k sqft1482 E 26th Ave, Columbus, OH 43211For SaleMLS ID #226033135, Michael Mcgee, Mainstay Brokerage LLC. Columbus and Central Ohio Regional MLS
- $99,0004 bd1 ba1.2k sqft333 S Warren Ave, Columbus, OH 43204For SaleMLS ID #226035243, Oliver Chapman, Keller Williams Consultants. Columbus and Central Ohio Regional MLS
