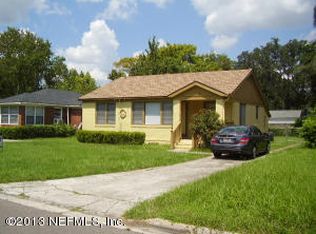
This 1493 square foot single family home has 3 bedrooms and 1.0 bathrooms. This home is located at 4713 Kerle St, Jacksonville, FL 32205.
Pre-foreclosure
Street View
Est. $310,900
4713 Kerle St, Jacksonville, FL 32205
3beds
1baths
1,493sqft
SingleFamily
Built in 1950
5,743 Square Feet Lot
$310,900 Zestimate®
$208/sqft
$-- HOA
Overview
- 340 days
- 20
- 0
Facts & features
Interior
Bedrooms & bathrooms
- Bedrooms: 3
- Bathrooms: 1
Heating
- Other
Cooling
- Wall
Features
- Flooring: Tile, Hardwood
- Has fireplace: Yes
- Fireplace features: masonry
Interior area
- Total interior livable area: 1,493 sqft
Property
Features
- Exterior features: Brick
Lot
- Size: 5,743 Square Feet
Details
- Parcel number: 0627600000
Construction
Type & style
- Home type: SingleFamily
Materials
- Roof: Asphalt
Condition
- Year built: 1950
Community & HOA
Location
- Region: Jacksonville
Financial & listing details
- Price per square foot: $208/sqft
- Tax assessed value: $256,020
- Annual tax amount: $4,189
Foreclosure details
Estimated market value
$310,900
$292,000 - $330,000
$1,642/mo
Price history
| Date | Event | Price |
|---|---|---|
| 10/11/2023 | Sold | $307,500+3.6%$206/sqft |
Source:  realMLS #1207775 Report a problem | ||
| 9/8/2023 | Pending sale | $296,900$199/sqft |
Source: realMLS #1207775 Report a problem | ||
| 8/12/2023 | Price change | $296,900-0.7%$199/sqft |
Source: realMLS #1207775 Report a problem | ||
| 7/27/2023 | Price change | $298,900-0.3%$200/sqft |
Source: realMLS #1207775 Report a problem | ||
| 7/20/2023 | Price change | $299,900-1.7%$201/sqft |
Source: realMLS #1207775 Report a problem | ||
| 7/13/2023 | Price change | $305,000-0.5%$204/sqft |
Source: realMLS #1207775 Report a problem | ||
| 7/6/2023 | Price change | $306,500-0.3%$205/sqft |
Source: realMLS #1207775 Report a problem | ||
| 6/30/2023 | Price change | $307,500-0.5%$206/sqft |
Source: realMLS #1207775 Report a problem | ||
| 6/22/2023 | Price change | $309,000-0.8%$207/sqft |
Source: realMLS #1207775 Report a problem | ||
| 6/3/2023 | Listed for sale | $311,500$209/sqft |
Source: realMLS #1207775 Report a problem | ||
| 4/15/2023 | Pending sale | $311,500$209/sqft |
Source: realMLS #1207775 Report a problem | ||
| 3/23/2023 | Price change | $311,500-0.8%$209/sqft |
Source: realMLS #1207775 Report a problem | ||
| 3/17/2023 | Price change | $314,000-1.6%$210/sqft |
Source: realMLS #1207775 Report a problem | ||
| 3/9/2023 | Price change | $319,000-1.5%$214/sqft |
Source: realMLS #1207775 Report a problem | ||
| 3/4/2023 | Price change | $324,000-1.5%$217/sqft |
Source: realMLS #1207775 Report a problem | ||
| 2/23/2023 | Price change | $329,000-1.5%$220/sqft |
Source: realMLS #1207775 Report a problem | ||
| 2/16/2023 | Price change | $334,000-1.5%$224/sqft |
Source: realMLS #1207775 Report a problem | ||
| 2/2/2023 | Price change | $339,000-1.5%$227/sqft |
Source: realMLS #1207775 Report a problem | ||
| 1/27/2023 | Price change | $344,000-1.4%$230/sqft |
Source: realMLS #1207775 Report a problem | ||
| 1/17/2023 | Listed for sale | $349,000+68.2%$234/sqft |
Source: realMLS #1207775 Report a problem | ||
| 9/8/2022 | Sold | $207,500-11.7%$139/sqft |
Source: realMLS #1186723 Report a problem | ||
| 8/22/2022 | Pending sale | $234,999$157/sqft |
Source: realMLS #1186723 Report a problem | ||
| 8/17/2022 | Listed for sale | $234,999$157/sqft |
Source: realMLS #1186723 Report a problem | ||
Public tax history
| Year | Property taxes | Tax assessment |
|---|---|---|
| 2025 | $4,189 +3% | $256,020 -0.3% |
| 2024 | $4,065 +6.8% | $256,839 +28.3% |
| 2023 | $3,805 +420.3% | $200,134 +198.2% |
| 2022 | $731 -0.8% | $67,118 +3% |
| 2021 | $737 +0.2% | $65,164 +1.4% |
| 2020 | $736 +4.1% | $64,265 +2.3% |
| 2019 | $707 +0.2% | $62,821 +1.9% |
| 2018 | $706 | $61,650 +2.1% |
| 2017 | $706 +0.1% | $60,382 +2.1% |
| 2016 | $705 -0.4% | $59,141 +0.7% |
| 2015 | $708 -1.1% | $58,730 +0.8% |
| 2014 | $716 | $58,264 +1.5% |
| 2013 | -- | $57,403 +1.7% |
| 2012 | -- | $56,444 +3% |
| 2011 | -- | $54,800 +1.5% |
| 2010 | -- | $53,991 +2.7% |
| 2009 | -- | $52,572 +5.7% |
| 2006 | -- | $49,747 +3% |
| 2005 | $433 | $48,298 +3% |
| 2004 | -- | $46,891 -11.7% |
| 2003 | $584 | $53,127 +18.2% |
| 2002 | -- | $44,938 +1.6% |
| 2001 | -- | $44,238 +7% |
| 2000 | -- | $41,338 +2.4% |
| 1999 | -- | $40,374 |
Find assessor info on the county website
Monthly payment
Climate risks
Neighborhood: Murray Hill

Similar homes
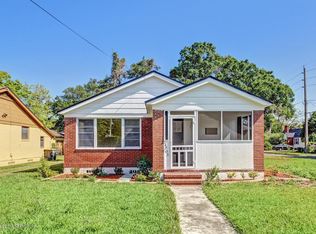
- $270,0003 bd1 ba1.2k sqft4709 LAWNVIEW Street, Jacksonville, FL 32205For Sale
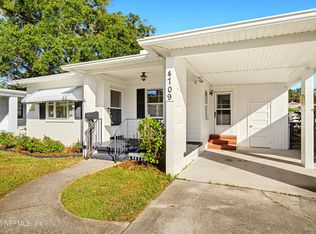 MLS ID #2171909, BENJAMIN C NUDEL. realMLS
- $299,9903 bd2 ba1.4k sqft4824 SAPPHO Avenue, Jacksonville, FL 32205For Sale
 MLS ID #2150158, TYRONE JACKSON. realMLS
- $294,5003 bd2 ba1.1k sqft4828 KERLE Street, Jacksonville, FL 32205For Sale
 MLS ID #2154256, LINDA (SUSANNE) FLYNN. realMLS
- $319,0003 bd2 ba1.3k sqft4652 COLLEGE Street, Jacksonville, FL 32205For Sale
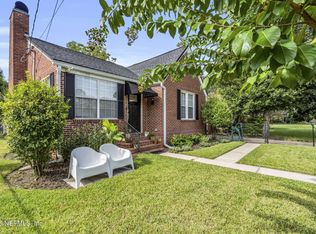 MLS ID #2163566, ALEXANDRIA GRACE HICKS. realMLS
