This 3 bedroom 2 bath home has a split floorplan. Features new carpet, new interior and exterior paint t/0 home and a new HVAC installed.
Active
Price cut: $4K (10/29)
$219,000
4848 S Baronsgate Way, Fort Mohave, AZ 86426
3beds
1,080sqft
Single Family Residence
Built in 1990
8,276 Square Feet Lot
$217,600 Zestimate®
$203/sqft
$-- HOA
What's special
Split floorplanNew carpet
- 35 days
- 714
- 82
Zillow last checked:
Listing updated:
Listed by:
Jared English 888-881-4118,
Congress Realty Inc.
Source: Momentum MLS,MLS#: 042654 Originating MLS: Western AZ Regional Real Estate Data Exchange
Facts & features
Interior
Bedrooms & bathrooms
- Bedrooms: 3
- Bathrooms: 2
- Full bathrooms: 2
Cooling
- Central Air, Electric
Appliances
- Included: Dishwasher, Electric Oven, Electric Range
Features
- Ceiling Fan(s)
Interior area
- Total structure area: 1,080
- Total interior livable area: 1,080 sqft
Video & virtual tour
Property
Parking
- Total spaces: 2
- Parking features: Attached
- Attached garage spaces: 2
Features
- Entry location: Ceiling Fan(s)
- Pool features: None
- Fencing: Block,Chain Link
Lot
- Size: 8,276 Square Feet
- Dimensions: 54 x 150
- Features: None
Details
- Parcel number: 22809016
- Zoning description: R1 Single-Family Residential
Construction
Type & style
- Home type: SingleFamily
- Property subtype: Single Family Residence
Materials
- Roof: Shingle
Condition
- New construction: No
- Year built: 1990
Utilities & green energy
- Water: Public
- Utilities for property: Electricity Available
Green energy
- Water conservation: Low-Flow Fixtures
Community & HOA
Community
- Subdivision: Courtney Greens
HOA
- Has HOA: No
Location
- Region: Fort Mohave
Financial & listing details
- Price per square foot: $203/sqft
- Tax assessed value: $156,933
- Annual tax amount: $943
- Date on market: 9/30/2026
- Cumulative days on market: 35 days
- Listing terms: Cash,Conventional,FHA,VA Loan
- Electric utility on property: Yes
Estimated market value
$217,600
$207,000 - $228,000
$1,653/mo
Price history
| Date | Event | Price |
|---|---|---|
| 10/29/2026 | Price change | $219,000-1.8%$203/sqft |
Source:  Momentum MLS #042654 Report a problem | ||
| 10/19/2026 | Price change | $223,000-0.9%$206/sqft |
Source: Momentum MLS #042654 Report a problem | ||
| 10/12/2026 | Price change | $225,000-1.3%$208/sqft |
Source: Momentum MLS #042654 Report a problem | ||
| 10/6/2026 | Price change | $227,900-0.9%$211/sqft |
Source: Momentum MLS #042654 Report a problem | ||
| 9/30/2026 | Listed for sale | $229,900+51.3%$213/sqft |
Source: Momentum MLS #042654 Report a problem | ||
| 8/26/2026 | Sold | $151,900-39.5%$141/sqft |
Source: Public Record Report a problem | ||
| 1/13/2023 | Sold | $251,000+5.9%$232/sqft |
Source: Momentum MLS #996912 Report a problem | ||
| 11/2/2022 | Pending sale | $237,000$219/sqft |
Source: Momentum MLS #996912 Report a problem | ||
| 10/28/2022 | Price change | $237,000-4.8%$219/sqft |
Source: Momentum MLS #996912 Report a problem | ||
| 10/14/2022 | Listed for sale | $249,000+394%$231/sqft |
Source: Momentum MLS #996912 Report a problem | ||
| 10/6/2010 | Sold | $50,400-32.7%$47/sqft |
Source: Public Record Report a problem | ||
| 7/27/2010 | Price change | $74,900-11.8%$69/sqft |
Source: Keller Williams Realty River Cities Specialists #843374 Report a problem | ||
| 7/10/2010 | Price change | $84,900-8.6%$79/sqft |
Source: Keller Williams Realty River Cities Specialists #843374 Report a problem | ||
| 5/23/2010 | Listed for sale | $92,900-43.4%$86/sqft |
Source: Fannie Mae Report a problem | ||
| 4/15/2010 | Sold | $164,145+2.6%$152/sqft |
Source: Public Record Report a problem | ||
| 11/17/2006 | Sold | $160,000+120.7%$148/sqft |
Source: Public Record Report a problem | ||
| 10/2/2000 | Sold | $72,500-8.1%$67/sqft |
Source: Public Record Report a problem | ||
| 6/6/2000 | Sold | $78,862$73/sqft |
Source: Public Record Report a problem | ||
Public tax history
| Year | Property taxes | Tax assessment |
|---|---|---|
| 2026 | $943 +9.4% | $15,693 +1.7% |
| 2025 | $862 +4.9% | $15,432 -8.3% |
| 2024 | $822 +1.9% | $16,835 +18.1% |
| 2023 | $807 -4.6% | $14,254 +25.3% |
| 2022 | $846 +121.9% | $11,380 +9.9% |
| 2021 | $381 -49.6% | $10,355 +16.2% |
| 2019 | $756 | $8,912 +11.4% |
| 2018 | $756 +0.3% | $8,000 +5.6% |
| 2017 | $754 +14.8% | $7,575 +1.3% |
| 2016 | $657 +0.7% | $7,476 +10.7% |
| 2015 | $652 | $6,755 +20.2% |
| 2014 | -- | $5,622 +5.1% |
| 2013 | -- | $5,348 +1.2% |
| 2012 | -- | $5,286 -7.3% |
| 2011 | -- | $5,704 -20.1% |
| 2010 | -- | $7,140 -19.6% |
| 2009 | -- | $8,878 -28.7% |
| 2008 | -- | $12,445 |
| 2007 | -- | -- |
| 2006 | -- | -- |
| 2005 | -- | -- |
| 2004 | -- | -- |
| 2003 | -- | -- |
| 2002 | -- | -- |
| 2000 | $417 | -- |
Find assessor info on the county website
Monthly payment
Est. payment
Payment breakdown
Explore the cost of this home by adjusting the details. Changes won't be saved.Climate risks
Neighborhood: 86426
- $249,000-- bd-- ba1.1k sqft4842 S Baronsgate Way, Fort Mohave, AZ 86426Off Market
- $152,500-- bd-- ba957 sqft4854 S Baronsgate Way, Fort Mohave, AZ 86426Off Market
- $248,5003 bd2 ba1.1k sqft4842 Baronsgate Way, Fort Mohave, AZ 86426Off Market

- $178,0003 bd2 ba1.2k sqft4836 S Baronsgate Way, Fort Mohave, AZ 86426Off Market

Similar homes
- $224,9003 bd2 ba1.1k sqft4351 S El Toro Drive, Fort Mohave, AZ 86426For Sale
 MLS ID #040229, Sheila Kennedy, Ms Bullhead City Real Estate. Momentum MLS
- $265,0003 bd2 ba1.2k sqft1605 E Rinaldi Way, Fort Mohave, AZ 86426For Sale
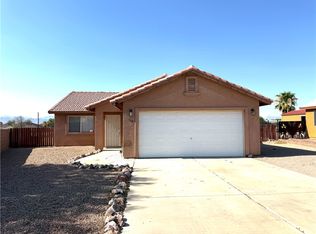 MLS ID #040796, Rodney Pryor, PMI US SOUTHWEST. Momentum MLS
- $238,0003 bd2 ba1k sqft1628 E Valencia Road, Fort Mohave, AZ 86426For Sale
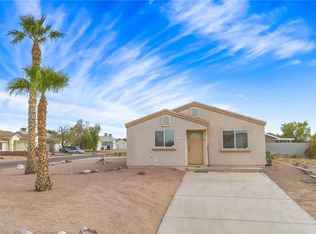 MLS ID #041469, Kristy Sharp, eXp Realty LLC. Momentum MLS
- $192,0002 bd2 ba1.1k sqft1290 E Hammer Road, Fort Mohave, AZ 86426For Sale
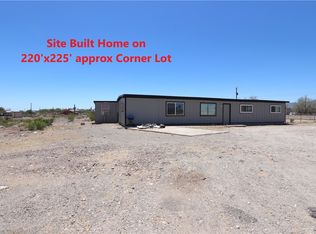 MLS ID #039026, Jami Bauer, KDH Desert Properties. Momentum MLS
