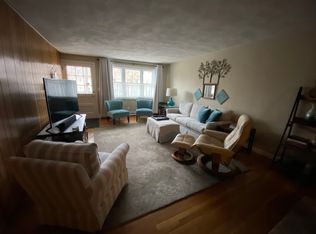
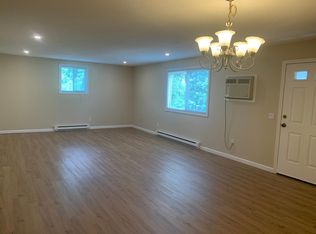
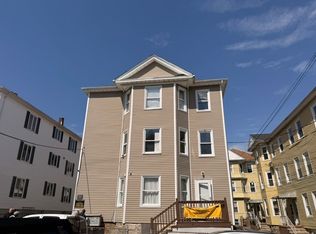
NEW TO MARKET. 49 Dennis St is an immaculately maintained asset in the heart of the City of Attleboro. Owned and managed by the same family for over 50 years, this property has maintained 100% occupancy with loyal tenants whom the ownership considers an extension of their own family. 9 total units (8 two-bedrooms & 1 three-bedroom). Rents are under market and presents your classic value-add opportunity. Separately metered utilities (baseboard electric heat) along with coin-op laundry in the basement. Ample parking for tenants in the rear of the building.
Pending
$1,750,000
49 Dennis St, Attleboro, MA 02703
19beds
9,508sqft
5-9 Family
Built in 1940
-- sqft lot
$-- Zestimate®
$184/sqft
$-- HOA
What's special
- 60 days
- 7
- 1
Zillow last checked:
Listing updated:
Listed by:
J P Plunkett,
Red Dome LLC 617-999-4993,
J P Plunkett
Source: MLS PIN,MLS#: 72961866
Facts & features
Interior
Bedrooms & bathrooms
- Bedrooms: 19
- Bathrooms: 9
- Full bathrooms: 9
Features
- Laundry Room
- Flooring: Wood
- Basement: Unfinished
- Has fireplace: No
Interior area
- Total structure area: 9,508
- Total interior livable area: 9,508 sqft
- Finished area above ground: 9,508
Property
Parking
- Total spaces: 18
- Parking features: Shared Driveway
- Uncovered spaces: 18
Features
- Patio & porch: Porch
Lot
- Size: 0.5 Acres
Details
- Parcel number: M:40 L:20E,2757993
- Zoning: R4
Construction
Type & style
- Home type: MultiFamily
- Property subtype: 5-9 Family
Materials
- Frame
- Foundation: Concrete Perimeter
- Roof: Shingle
Condition
- Year built: 1940
Utilities & green energy
- Sewer: Public Sewer
- Water: Public
Community & HOA
Location
- Region: Attleboro
Financial & listing details
- Price per square foot: $184/sqft
- Tax assessed value: $776,700
- Annual tax amount: $11,223
- Date on market: 8/23/2026
- Total actual rent: 9815
Estimated market value
Not available
Estimated sales range
Not available
$2,040/mo
Price history
| Date | Event | Price |
|---|---|---|
| 9/23/2026 | Pending sale | $1,750,000$184/sqft |
Source: MLS PIN #72961866 Report a problem | ||
| 6/3/2022 | Listing removed | -- |
Source: MLS PIN #72961866 Report a problem | ||
| 4/4/2022 | Listed for sale | $1,750,000$184/sqft |
Source: MLS PIN #72961866 Report a problem | ||
| 3/24/2021 | Listing removed | -- |
Source: Owner Report a problem | ||
| 11/22/2018 | Listing removed | $1,250 |
Source: Owner Report a problem | ||
| 11/12/2018 | Listed for rent | $1,250 |
Source: Owner Report a problem | ||
Public tax history
| Year | Property taxes | Tax assessment |
|---|---|---|
| 2024 | $19,954 +68.9% | $1,567,500 +81.7% |
| 2023 | $11,813 +5.3% | $862,900 +11.1% |
| 2022 | $11,223 +43.4% | $776,700 +46.8% |
| 2021 | $7,829 +0.9% | $529,000 -0.7% |
| 2020 | $7,759 +1.8% | $532,900 -1% |
| 2019 | $7,622 +2.5% | $538,300 +7.3% |
| 2018 | $7,435 -0.3% | $501,700 -2.1% |
| 2017 | $7,460 +5.5% | $512,700 +7.5% |
| 2016 | $7,071 +13.1% | $477,100 +12.2% |
| 2015 | $6,253 -1.1% | $425,100 -0.1% |
| 2014 | $6,320 +13.4% | $425,600 +6% |
| 2013 | $5,573 -5.4% | $401,500 -12.3% |
| 2012 | $5,894 -5.2% | $457,600 -10.2% |
| 2011 | $6,218 -21.3% | $509,700 -27.7% |
| 2010 | $7,898 +6.7% | $705,200 -3.8% |
| 2009 | $7,400 +4% | $733,400 -2.7% |
| 2008 | $7,112 +23.9% | $753,400 +26.9% |
| 2007 | $5,739 +8.5% | $593,500 +9.3% |
| 2006 | $5,290 -1.3% | $543,100 +2.2% |
| 2005 | $5,361 +25.1% | $531,300 +65.3% |
| 2004 | $4,287 +5.1% | $321,400 +2% |
| 2003 | $4,079 +14.1% | $315,000 +39.2% |
| 2001 | $3,576 +3% | $226,300 |
| 2000 | $3,471 -8.8% | $226,300 -24.7% |
| 1995 | $3,807 | $300,700 |
Find assessor info on the county website
Monthly payment
Est. payment
Payment breakdown
Explore the cost of this home by adjusting the details. Changes won't be saved.Climate risks
Neighborhood: 02703


Similar homes
- $1,350,00018 bd9 ba6.7k sqft426 Whittenton St, Taunton, MA 02780For Sale
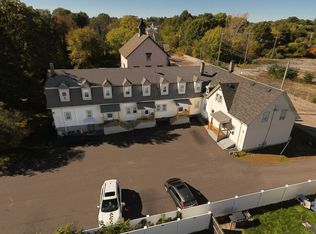 MLS ID #73590799, AJ Andrews, Century 21 Realty Network. MLS PIN
- $929,00017 bd7 ba6k sqft409-415 Rathbun St, Woonsocket, RI 02895For Sale
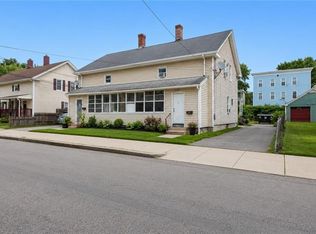
 MLS ID #1421531, Talib Hussain, Keller Williams Realty. StateWide MLS RI
- $929,00017 bd7 ba6k sqft411 Rathbun St, Woonsocket, RI 02895For Sale
 MLS ID #73570515, Talib Hussain, Keller Williams Elite. MLS PIN
- $1,200,00018 bd6 ba6.2k sqft227 Eagle St, Fall River, MA 02721For Sale
 MLS ID #73515615, Gilnerys Santana, Amaral & Associates RE. MLS PIN
