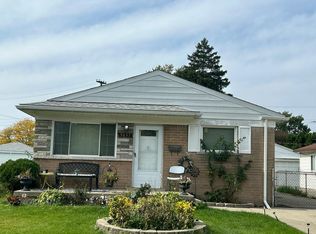
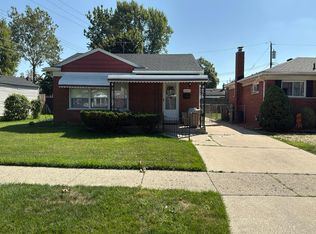
This house is 989 sqft has 3 bedrooms and 2 bathrooms- main bathrooms has just been remodeled and all 3 bedrooms has new floors. Drive needs repairs . House is for sale by owner and selling as is . $218,000 . ..
there is option to by under land contract with 35k down payment and 2 year buy out and $1,600 a month for the 2 year period . buyer will be responsible for all taxes during the 2 year contract .
For sale by owner
$218,000
4929 Fleming St, Dearborn Heights, MI 48125
3beds
989sqft
SingleFamily
Built in 1953
7,971 Square Feet Lot
$-- Zestimate®
$220/sqft
$-- HOA
Overview
- 24 days
- 608
- 20
Listed by:
Property Owner (734) 341-6231
Facts & features
Interior
Bedrooms & bathrooms
- Bedrooms: 3
- Bathrooms: 2
- Full bathrooms: 2
Heating
- Forced air
Interior area
- Total interior livable area: 989 sqft
Property
Parking
- Parking features: Garage - Attached
Features
- Exterior features: Other
Lot
- Size: 7,971 Square Feet
Details
- Parcel number: 33055011432002
Construction
Type & style
- Home type: SingleFamily
Condition
- New construction: No
- Year built: 1953
Community & HOA
Location
- Region: Dearborn Heights
Financial & listing details
- Price per square foot: $220/sqft
- Tax assessed value: $81,500
- Date on market: 10/20/2026
Estimated market value
Not available
Estimated sales range
Not available
$1,733/mo
Price history
| Date | Event | Price |
|---|---|---|
| 10/20/2026 | Listed for sale | $218,000+1.4%$220/sqft |
Source: Owner Report a problem | ||
| 8/14/2026 | Listing removed | -- |
Source: Owner Report a problem | ||
| 5/16/2026 | Listed for sale | $215,000+115%$217/sqft |
Source: Owner Report a problem | ||
| 9/9/2025 | Sold | $100,000$101/sqft |
Source: Public Record Report a problem | ||
Public tax history
| Year | Property taxes | Tax assessment |
|---|---|---|
| 2026 | -- | $81,500 +4.2% |
| 2025 | -- | $78,200 +29.3% |
| 2024 | -- | $60,500 +15.5% |
| 2023 | -- | $52,400 +14.7% |
| 2022 | -- | $45,700 +8% |
| 2021 | -- | $42,300 |
| 2020 | $2,240 +3.6% | $42,300 +9% |
| 2019 | $2,162 | $38,800 +19% |
| 2018 | $2,162 | $32,600 +3.2% |
| 2017 | -- | $31,600 +1.9% |
| 2016 | $1,996 | $31,000 +7.3% |
| 2015 | $1,996 -30.7% | $28,900 -3.3% |
| 2013 | $2,880 +44.3% | $29,900 -17.9% |
| 2010 | $1,996 | $36,400 -19.5% |
| 2008 | -- | $45,200 -10.7% |
| 2006 | $1,285 -36.9% | $50,600 -1.4% |
| 2005 | $2,038 +2.4% | $51,300 +6.4% |
| 2003 | $1,991 | $48,200 +61.5% |
| 2001 | -- | $29,836 +3.2% |
| 2000 | $1,822 | $28,911 |
Find assessor info on the county website
Monthly payment
Est. payment
Payment breakdown
Explore the cost of this home by adjusting the details. Changes won't be saved.Climate risks
Neighborhood: Crestview
- $176,3003 bd2 ba925 sqft24418 Currier St, Dearborn Heights, MI 48125Off Market

- $300,0004 bd4 ba1.7k sqft4524 Kingston St, Dearborn Heights, MI 48125Sold
- $361,4003 bd-- ba1.4k sqft25586 Edinborough St, Dearborn Heights, MI 48125Off Market
- $179,6003 bd1 ba1.1k sqft4191 Monroe St, Dearborn Heights, MI 48125Off Market

Similar homes
- $--3 bd2 ba1.2k sqft3125 John Daly St, Inkster, MI 48141Auction
 Auction.com 2
- $--4 bd1 ba1k sqft6111 Mc Guire, Taylor, MI 48180AuctionAuction.com 2
- $--3 bd2 ba936 sqft5657 Nightingale St, Dearborn Heights, MI 48127Auction
 Auction.com 2
- $--3 bd1 ba1k sqft24325 Munson St, Taylor, MI 48180Auction
 Auction.com 2
- $225,0003 bd2 ba1k sqft8225 Lochdale St, Dearborn Heights, MI 48127For Sale
 MLS ID #20261064208, Romond Gordon, The Gordon Realty Group. Realcomp II
