LARGE BRICK 3 FLAT WITH ADDITIONAL SIDE DOOR ENTRANCE GARDEN-BASEMENT UNIT. PROPERTY BEING SOLD AS IS CONDITION, NO SURVEYS NOR DISCLOSURES. BUYER TO TAKE OVER BUILDING CODE VIOLATIONS (ROOM COUNTS / SIZES ARE ESTIMATES). THERE IS A FULL BASEMENT WITH HIGH CEILINGS. DONT MISS THIS ONE.
Price change
Price cut: $30.9K (11/5)
$249,000
4930 W Washington Blvd, Chicago, IL 60644
9beds
--sqft
Multi Family
Built in 1903
-- sqft lot
$-- Zestimate®
$--/sqft
$-- HOA
What's special
Additional side door entranceGarden-basement unit
- 19 days
- 685
- 33
Zillow last checked:
Listing updated:
Listed by:
Antonio Wolf 678-469-0492,
O'ANIF Real Estate & Development
Source: MRED as distributed by MLS GRID,MLS#: 12776435
Facts & features
Interior
Bedrooms & bathrooms
- Bedrooms: 9
- Bathrooms: 3
- Full bathrooms: 3
Heating
- Has Heating (Unspecified Type)
Features
- Basement: Unfinished,Full
Property
Lot
- Size: 3,125 Square Feet
- Dimensions: 25 X 125
Details
- Parcel number: 16094230260000
- Special conditions: None
Construction
Type & style
- Home type: MultiFamily
- Property subtype: Multi Family
Materials
- Brick
Condition
- New construction: No
- Year built: 1903
Utilities & green energy
- Sewer: Public Sewer
- Water: Public
Community & HOA
Location
- Region: Chicago
Financial & listing details
- Tax assessed value: $340,000
- Annual tax amount: $4,016
- Date on market: 10/21/2026
- Ownership: Fee Simple
Estimated market value
Not available
Estimated sales range
Not available
$2,458/mo
Price history
| Date | Event | Price |
|---|---|---|
| 11/5/2026 | Price change | $249,000-11% |
Source:  MRED as distributed by MLS GRID #12776435 Report a problem | ||
| 10/21/2026 | Listed for sale | $279,900 |
Source: MRED as distributed by MLS GRID #12776435 Report a problem | ||
Public tax history
| Year | Property taxes | Tax assessment |
|---|---|---|
| 2024 | $6,831 +70.1% | $34,000 +36% |
| 2023 | $4,016 +3.6% | $25,000 |
| 2022 | $3,876 +845.2% | $25,000 |
| 2021 | $410 -3.1% | $25,000 +9.1% |
| 2020 | $423 +0.3% | $22,912 -12% |
| 2019 | $422 +1.5% | $26,037 |
| 2018 | $416 -6.6% | $26,037 +17.5% |
| 2017 | $445 -48.6% | $22,158 |
| 2016 | $866 -78.7% | $22,158 |
| 2015 | $4,060 +392% | $22,158 -0.5% |
| 2014 | $825 -0.4% | $22,274 |
| 2013 | $828 +6.8% | $22,274 |
| 2012 | $775 +0.6% | $22,274 -15.4% |
| 2011 | $770 +10.6% | $26,327 |
| 2010 | $696 -76.7% | $26,327 |
| 2009 | $2,995 +325.3% | $26,327 -25.8% |
| 2008 | $704 -9.7% | $35,492 |
| 2007 | $780 -5.8% | $35,492 |
| 2006 | $828 -14.1% | $35,492 +62.8% |
| 2005 | $964 -53.7% | $21,806 |
| 2004 | $2,083 +89.1% | $21,806 |
| 2003 | $1,102 -11.6% | $21,806 +55.9% |
| 2002 | $1,246 -6.6% | $13,985 |
| 2001 | $1,334 -8.8% | $13,985 |
| 2000 | $1,462 | $13,985 +26.4% |
| 1999 | $1,462 | $11,066 |
Find assessor info on the county website
Monthly payment
Est. payment
Payment breakdown
Explore the cost of this home by adjusting the details. Changes won't be saved.Climate risks
Neighborhood: South Austin
Nearby schools
- $373,7008 bd-- ba3.6k sqft4934 W Washington Blvd, Chicago, IL 60644Off Market

- $273,9006 bd3 ba4.8k sqft4936 W Washington Blvd, Chicago, IL 60644Off Market
- $381,0006 bd3 ba3.4k sqft4924 W Washington Blvd, Chicago, IL 60644Off Market
- $267,7002 bd1 ba920 sqft4938 W Washington Blvd #G, Chicago, IL 60644Off Market

Similar homes
- $291,6007 bd2 ba-- sqft319 N Lotus Ave, Chicago, IL 60644Active
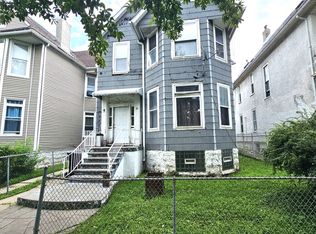 MLS ID #12787450, Michael Olszewski, Area Wide Realty. MRED as distributed by MLS GRID
- $250,0006 bd2 ba-- sqft4425 W Carroll Ave, Chicago, IL 60624Active
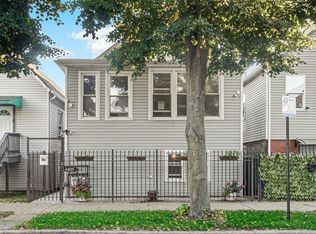 MLS ID #12780558, Ola Sanni, Century 21 S.G.R., Inc.. MRED as distributed by MLS GRID
- $--6 bd2 ba2.5k sqft1424 S Ridgeway Ave, Chicago, IL 60623Auction
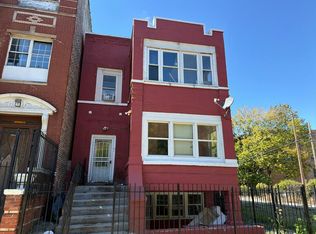 Auction.com 2
- $--6 bd2 ba3.3k sqft5456 W Ferdinand St, Chicago, IL 60644Auction
 Auction.com 1
