Exceptional Three-Family Investment Opportunity in Providence! Don’t miss this opportunity to own a spacious three-family property located on Hartford Avenue in Providence. This property offers excellent potential for investors or owner-occupants looking to generate rental income while building equity. The property features three separate residential units, offering flexibility for rental income or multi-generational living. Whether you’re expanding your investment portfolio or looking for an owner-occupied opportunity, this property offers tremendous potential in a convenient Providence location. Schedule your showing today!
Active
$649,999
506 Hartford Ave, Providence, RI 02909
7beds
2,796sqft
Multi Family
Built in 1910
-- sqft lot
$652,100 Zestimate®
$232/sqft
$-- HOA
What's special
Three separate residential units
- 2 days
- 276
- 11
Zillow last checked:
Listing updated:
Listed by:
Mauro Orellana 401-263-1424,
Real Broker, LLC
Source: StateWide MLS RI,MLS#: 1428682
Facts & features
Interior
Bedrooms & bathrooms
- Bedrooms: 7
- Bathrooms: 3
- Full bathrooms: 3
Heating
- Natural Gas, Gas Connected
Cooling
- None
Appliances
- Included: Electric Water Heater
Features
- Flooring: Ceramic Tile, Other, Carpet
- Basement: Full,Interior Entry,Unfinished
- Has fireplace: No
Interior area
- Total structure area: 4,151
- Total interior livable area: 2,796 sqft
Property
Parking
- Total spaces: 3
- Parking features: No Garage
Lot
- Size: 4,399 Square Feet
Details
- Parcel number: PROVM112L190
Construction
Type & style
- Home type: MultiFamily
- Property subtype: Multi Family
- Attached to another structure: Yes
Materials
- Vinyl Siding
Condition
- New construction: No
- Year built: 1910
Utilities & green energy
- Electric: 100 Amp Service
- Sewer: Public Sewer
- Water: Public
Community & HOA
HOA
- Has HOA: No
Location
- Region: Providence
Financial & listing details
- Price per square foot: $232/sqft
- Tax assessed value: $536,800
- Annual tax amount: $7,515
- Date on market: 11/17/2026
- Total actual rent: 0
- Tenant pays: Heat
Estimated market value
$652,100
$619,000 - $685,000
$2,426/mo
Price history
| Date | Event | Price |
|---|---|---|
| 11/17/2026 | Listed for sale | $649,999+664.7%$232/sqft |
Source:  StateWide MLS RI #1428682 Report a problem | ||
| 12/30/2008 | Sold | $85,000-61.2%$30/sqft |
Source: Public Record Report a problem | ||
| 4/9/2008 | Sold | $219,109+6849.2%$78/sqft |
Source: Public Record Report a problem | ||
| 10/17/2007 | Sold | $3,153-98.9%$1/sqft |
Source: Public Record Report a problem | ||
| 5/17/2005 | Sold | $280,000+174.5%$100/sqft |
Source: Public Record Report a problem | ||
| 7/9/1997 | Sold | $102,000$36/sqft |
Source: Public Record Report a problem | ||
Public tax history
| Year | Property taxes | Tax assessment |
|---|---|---|
| 2025 | $4,053 -30.8% | $536,800 +68.3% |
| 2024 | $5,854 +3.1% | $319,000 |
| 2023 | $5,678 | $319,000 |
| 2022 | $5,678 +14.5% | $319,000 +58% |
| 2021 | $4,959 +0% | $201,900 |
| 2020 | $4,959 +7.5% | $201,900 +7.5% |
| 2019 | $4,612 +12.7% | $187,800 +46.6% |
| 2018 | $4,094 +0% | $128,100 |
| 2017 | $4,094 | $128,100 |
| 2016 | $4,094 +9.8% | $128,100 +13.8% |
| 2015 | $3,727 -1.9% | $112,600 |
| 2013 | $3,800 -25.1% | $112,600 -29.2% |
| 2012 | $5,074 | $159,100 |
| 2011 | $5,074 +5% | $159,100 |
| 2010 | $4,833 -40.8% | $159,100 -52.8% |
| 2009 | $8,168 +6% | $337,400 |
| 2007 | $7,706 +27.3% | $337,400 +68.5% |
| 2006 | $6,052 | $200,200 |
| 2005 | $6,052 | $200,200 |
Find assessor info on the county website
Monthly payment
Est. payment
Payment breakdown
Explore the cost of this home by adjusting the details. Changes won't be saved.Climate risks
Neighborhood: Hartford


Similar homes
- $569,9007 bd4 ba2k sqft32 Judith St, Providence, RI 02909For Sale
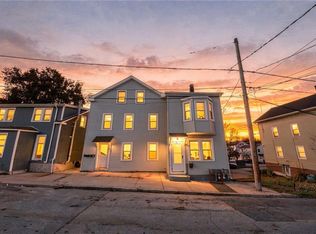
 MLS ID #1428891, Joanna Edwards, Thumbprint Realty. StateWide MLS RI
- $499,9006 bd2 ba2k sqft29 Steuben St, Providence, RI 02909For Sale
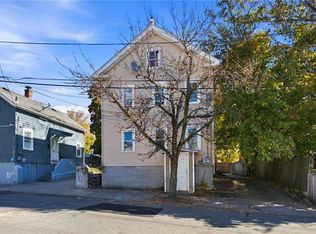 MLS ID #1427742, Kyle Seyboth, Century 21 Limitless. StateWide MLS RI
- $675,0006 bd3 ba3.1k sqft9-11 Lawn St, Providence, RI 02908For Sale
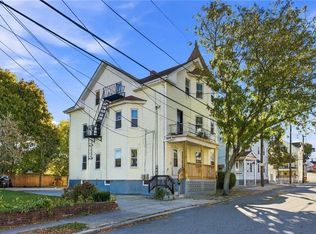 MLS ID #1427321, Kyle Seyboth, Century 21 Limitless. StateWide MLS RI
- $665,0007 bd3 ba2.5k sqft155 Alabama Ave, Providence, RI 02905For Sale
 MLS ID #1427934, Amy Champagne, Capital Leasing & Managment. StateWide MLS RI
- $614,9006 bd2 ba2.4k sqft113 Radcliffe Ave, Providence, RI 02908For SaleMLS ID #1425913, The ALBA Group, Innovations Realty. StateWide MLS RI
- $477,0006 bd3 ba2.8k sqft28 Armington Ave, Providence, RI 02908For SaleMLS ID #1428478, Kyle Seyboth, Century 21 Limitless. StateWide MLS RI
- $569,9005 bd3 ba2.5k sqft85 Moorland Ave, Providence, RI 02908For SaleMLS ID #1428905, Brian Greene, Keller Williams Leading Edge. StateWide MLS RI
- $650,0008 bd3 ba3.1k sqft53 Alger Ave, Providence, RI 02907For SaleMLS ID #1426518, Kyle Seyboth, Century 21 Limitless. StateWide MLS RI
- $729,9007 bd3 ba2.7k sqft61 Emanuel St, North Providence, RI 02911For SaleMLS ID #1427701, Melissa Riley, Westcott Properties. StateWide MLS RI
- $825,0005 bd2 ba1.8k sqft90 Oak St, Providence, RI 02909For SaleMLS ID #1427993, Roberto Mejia, Redfin Corporation. StateWide MLS RI
- $585,0007 bd3 ba2.2k sqft33 Wood St, Providence, RI 02907For SaleMLS ID #1421908, Jean Feliciano, Stateline Real Estate. StateWide MLS RI
- $693,0007 bd3 ba3.2k sqft1213 Smith St, Providence, RI 02908For SaleMLS ID #1422206, List with Lyon Team, HERE Realty. StateWide MLS RI
- $535,0005 bd3 ba1.7k sqft1-2 Hale St, Providence, RI 02909For SaleMLS ID #1421631, Stateline Team, Stateline Real Estate. StateWide MLS RI
- $379,0004 bd2 ba1.4k sqft974 Manton Ave, Providence, RI 02909For SaleMLS ID #1428814, Cody Sequino, Harborside Realty. StateWide MLS RI
- $599,0004 bd3 ba1.8k sqft35-39 Winona St, Providence, RI 02904For SaleMLS ID #1424424, The Blackstone Team, Compass. StateWide MLS RI
- $724,9008 bd3 ba2.4k sqft63-67 Farnum Pike, Smithfield, RI 02917For SaleMLS ID #1428865, Codi Ethier, REMAX Revolution. StateWide MLS RI
- $629,0006 bd3 ba2k sqft884 River Ave, Providence, RI 02908For SaleMLS ID #1417243, Claudia Ramirez, Innovations Realty. StateWide MLS RI
- $675,00010 bd4 ba3.5k sqft142 Oxford St, Providence, RI 02905For SaleMLS ID #1426506, Kyle Seyboth, Century 21 Limitless. StateWide MLS RI
- $579,9006 bd3 ba2.5k sqft74 Veazie St, Providence, RI 02908For SaleMLS ID #1422105, Anastasia Kaufman, REMAX Revolution. StateWide MLS RI
