Located in Fall River’s desirable East End, this two-family property offers two generously sized three-bedroom units. The home was completely remodeled in 2008, with newer electrical, plumbing, heating and windows. The hot water heaters were replaced in 2018 and 2023. Additional features include natural gas, city water, sewer, and off-street parking. Currently fully owner-occupied, both units will be delivered vacant.
For sale
$599,900
51 Horton St, Fall River, MA 02723
6beds
3,018sqft
Multi Family
Built in 1930
-- sqft lot
$593,900 Zestimate®
$199/sqft
$-- HOA
What's special
- 1 day
- 116
- 4
Zillow last checked:
Listing updated:
Listed by:
Michelle Nadeau 508-272-3194,
Realty Executives Metro South 508-880-0900
Source: MLS PIN,MLS#: 73600902
Facts & features
Interior
Bedrooms & bathrooms
- Bedrooms: 6
- Bathrooms: 2
- Full bathrooms: 2
Heating
- Forced Air, Baseboard, Natural Gas
Cooling
- Other, Window Unit(s)
Appliances
- Included: Range, Refrigerator
- Laundry: Washer Hookup
Features
- Living Room, Kitchen
- Flooring: Wood, Tile, Carpet
- Basement: Full,Interior Entry,Bulkhead,Concrete,Unfinished
- Has fireplace: No
Interior area
- Total structure area: 3,018
- Total interior livable area: 3,018 sqft
- Finished area above ground: 3,018
Property
Parking
- Total spaces: 4
- Parking features: Paved Drive, Off Street
- Uncovered spaces: 4
Lot
- Size: 2,648 Square Feet
- Features: Level
Details
- Parcel number: 2829324
- Zoning: G
Construction
Type & style
- Home type: MultiFamily
- Property subtype: Multi Family
Materials
- Frame
- Foundation: Irregular
- Roof: Shingle
Condition
- Year built: 1930
Utilities & green energy
- Electric: Circuit Breakers
- Sewer: Public Sewer
- Water: Public
- Utilities for property: for Gas Range, Washer Hookup
Community & HOA
Community
- Features: Public Transportation, Highway Access
Location
- Region: Fall River
Financial & listing details
- Price per square foot: $199/sqft
- Tax assessed value: $510,100
- Annual tax amount: $5,856
- Date on market: 11/11/2026
- Listing terms: Contract
- Total actual rent: 0
Estimated market value
$593,900
$564,000 - $624,000
$2,007/mo
Price history
| Date | Event | Price |
|---|---|---|
| 11/11/2026 | Listed for sale | $599,900+155.8%$199/sqft |
Source: MLS PIN #73600902 Report a problem | ||
| 11/16/2018 | Sold | $234,500+2.4%$78/sqft |
Source: Public Record Report a problem | ||
| 10/2/2018 | Listed for sale | $229,000+2.2%$76/sqft |
Source: Anchor Realty #72404176 Report a problem | ||
| 8/21/2009 | Sold | $224,000-6.3%$74/sqft |
Source: Public Record Report a problem | ||
| 6/19/2009 | Price change | $239,000+1.7%$79/sqft |
Source: Owner Report a problem | ||
| 4/14/2009 | Listed for sale | $235,000+156.9%$78/sqft |
Source: Owner Report a problem | ||
| 1/21/2009 | Sold | $91,485-13.7%$30/sqft |
Source: Public Record Report a problem | ||
| 11/24/2008 | Listed for sale | $106,000-20.2%$35/sqft |
Source: foreclosure.com Report a problem | ||
| 4/7/2008 | Sold | $132,883+10.7%$44/sqft |
Source: Public Record Report a problem | ||
| 7/2/2001 | Sold | $120,000$40/sqft |
Source: Public Record Report a problem | ||
Public tax history
| Year | Property taxes | Tax assessment |
|---|---|---|
| 2025 | $5,386 +8.9% | $470,400 +9.3% |
| 2024 | $4,944 +13.3% | $430,300 +21% |
| 2023 | $4,364 +9.5% | $355,700 +12.6% |
| 2022 | $3,987 +9.1% | $315,900 +19.5% |
| 2021 | $3,655 +12.4% | $264,300 +17.5% |
| 2020 | $3,251 +31.7% | $225,000 +32.9% |
| 2019 | $2,468 +2.7% | $169,300 +3% |
| 2018 | $2,404 +6.7% | $164,400 +2.2% |
| 2017 | $2,253 +2.1% | $160,900 -0.6% |
| 2016 | $2,207 +6.2% | $161,900 +1.9% |
| 2015 | $2,078 -3.2% | $158,900 -6.9% |
| 2014 | $2,146 +3.6% | $170,600 -1.8% |
| 2013 | $2,072 +5.2% | $173,700 -3.2% |
| 2012 | $1,970 +44.1% | $179,400 +18.7% |
| 2010 | $1,367 -19.8% | $151,200 -32% |
| 2008 | $1,704 +6.3% | $222,200 -0.5% |
| 2007 | $1,603 +16.7% | $223,300 +11% |
| 2006 | $1,374 +5.9% | $201,100 +18% |
| 2005 | $1,297 +7.1% | $170,400 +15.5% |
| 2004 | $1,211 +13.5% | $147,500 +48.1% |
| 2003 | $1,067 +8.9% | $99,600 |
| 2002 | $980 -1% | $99,600 +5.3% |
| 2000 | $990 +32.9% | $94,600 +16.5% |
| 1995 | $745 | $81,200 |
Find assessor info on the county website
Monthly payment
Est. payment
Payment breakdown
Explore the cost of this home by adjusting the details. Changes won't be saved.Climate risks
Neighborhood: 02723


Similar homes
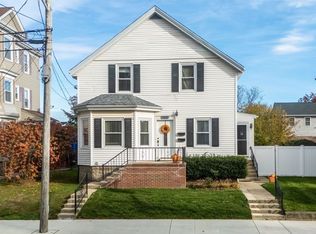
- $585,8005 bd3 ba3.2k sqft463 Oak Grove Ave, Fall River, MA 02723For Sale
 MLS ID #73598984, Ashley Dusoe, LPT Realty - Home & Key Group. MLS PIN
- $599,9006 bd3 ba2.6k sqft185 Covel St, Fall River, MA 02723For Sale
 MLS ID #73572594, Henry Alfonso, Alfonso Realty Co.. MLS PIN
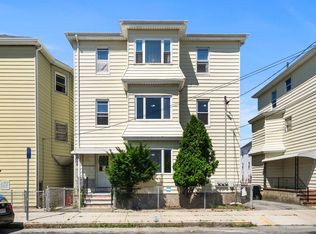
- $579,0006 bd3 ba2.4k sqft95 Flint St, Fall River, MA 02723For Sale
 MLS ID #73562801, Shalaye Camillo, Vital Source Realty. MLS PIN
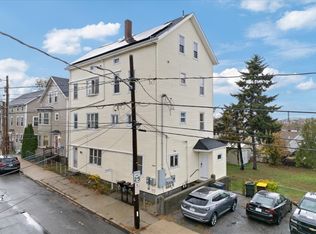
- $649,9008 bd3 ba3.5k sqft498 Tecumseh St, Fall River, MA 02721For Sale
 MLS ID #73600138, D. Brian Colville III, HomeSmart First Class Realty. MLS PIN
