Highest & Best by 11/05/26 EOD. Investors, take notice!! An incredible opportunity to get into a lake property on almost a full acre in East Haddam. Located on beautiful Lake Hayward with incredible lake views and lake rights. Great opportunity for an owner or investor to make it their own.
Under contract
$199,000
51 Hungerford Road East, East Haddam, CT 06423
3beds
950sqft
Single Family Residence
Built in 1943
0.73 Acres Lot
$-- Zestimate®
$209/sqft
$-- HOA
What's special
Incredible lake views
- 9 days
- 1,170
- 66
Likely to sell faster than
Zillow last checked:
Listing updated:
Listed by:
Dillon Cass (914)278-4363,
Star Realty LLC 203-998-0407
Source: Smart MLS,MLS#: 24217778
Facts & features
Interior
Bedrooms & bathrooms
- Bedrooms: 3
- Bathrooms: 1
- Full bathrooms: 1
Primary bedroom
- Level: Main
Bedroom
- Level: Main
Bedroom
- Level: Main
Dining room
- Level: Main
Living room
- Level: Main
Heating
- Forced Air, Oil
Cooling
- None
Appliances
- Included: None
Features
- Basement: Partial
- Attic: None
- Has fireplace: No
Interior area
- Total structure area: 950
- Total interior livable area: 950 sqft
- Finished area above ground: 950
Property
Features
- Has view: Yes
- View description: Water
- Has water view: Yes
- Water view: Water
- Waterfront features: Waterfront, Lake
Lot
- Size: 0.73 Acres
- Features: Few Trees
Details
- Parcel number: 2269342
- Zoning: L
Construction
Type & style
- Home type: SingleFamily
- Architectural style: Ranch
- Property subtype: Single Family Residence
Materials
- Vinyl Siding
- Foundation: Concrete Perimeter
- Roof: Asphalt
Condition
- New construction: No
- Year built: 1943
Utilities & green energy
- Sewer: Septic Tank
- Water: Well
Community & HOA
HOA
- Has HOA: No
Location
- Region: East Haddam
Financial & listing details
- Price per square foot: $209/sqft
- Tax assessed value: $173,660
- Annual tax amount: $4,979
- Date on market: 10/31/2026
Estimated market value
Not available
Estimated sales range
Not available
$2,326/mo
Price history
| Date | Event | Price |
|---|---|---|
| 11/6/2026 | Pending sale | $199,000$209/sqft |
Source:  Smart MLS #24217778 Report a problem | ||
| 10/31/2026 | Listed for sale | $199,000+121.1%$209/sqft |
Source: Smart MLS #24217778 Report a problem | ||
| 8/17/2026 | Sold | $90,000-35.7%$95/sqft |
Source: Public Record Report a problem | ||
| 10/9/2014 | Listing removed | $1,075$1/sqft |
Source: Hayward Properties #N353483 Report a problem | ||
| 10/8/2014 | Listed for rent | $1,075$1/sqft |
Source: Hayward Properties #N353483 Report a problem | ||
| 8/22/2014 | Listed for sale | $139,900$147/sqft |
Source: Hayward Properties #N353485 Report a problem | ||
Public tax history
| Year | Property taxes | Tax assessment |
|---|---|---|
| 2025 | $4,873 +4.9% | $173,660 |
| 2024 | $4,647 +3.9% | $173,660 |
| 2023 | $4,472 +10.6% | $173,660 +36.5% |
| 2022 | $4,043 +4.4% | $127,180 |
| 2021 | $3,871 | $127,180 |
| 2020 | $3,871 | $127,180 |
| 2019 | $3,871 +2.6% | $127,180 |
| 2018 | $3,772 +14.7% | $127,180 +14.3% |
| 2017 | $3,290 +3.1% | $111,230 |
| 2015 | $3,190 +2.8% | $111,230 |
| 2014 | $3,103 +7.3% | $111,230 |
| 2013 | $2,893 +3% | $111,230 -14.8% |
| 2012 | $2,810 +2.5% | $130,590 |
| 2011 | $2,742 +0.6% | $130,590 0% |
| 2010 | $2,726 +1.6% | $130,600 +0% |
| 2009 | $2,684 | $130,590 0% |
| 2008 | $2,684 +54.8% | $130,600 +109.2% |
| 2007 | $1,734 +2% | $62,420 |
| 2006 | $1,700 +4.9% | $62,420 +1.3% |
| 2005 | $1,620 +3.7% | $61,630 |
| 2004 | $1,562 -27.3% | $61,630 -30% |
| 2003 | $2,149 +59.2% | $88,040 +95.2% |
| 2001 | $1,350 -16.9% | $45,100 -30.1% |
| 1995 | $1,624 | $64,510 |
Find assessor info on the county website
Monthly payment
Est. payment
Payment breakdown
Explore the cost of this home by adjusting the details. Changes won't be saved.Climate risks
Neighborhood: 06423

Similar homes
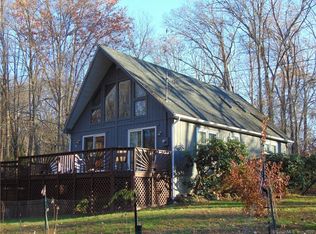
- $199,5001 bd1 ba480 sqft61 BAILEY Road, East Haddam, CT 06423For Sale

 MLS ID #24215061, Limmy Evans, Century 21 AllPoints Realty. Smart MLS
- $249,0002 bd1 ba966 sqft64 Elm Street, Colchester, CT 06415For Sale
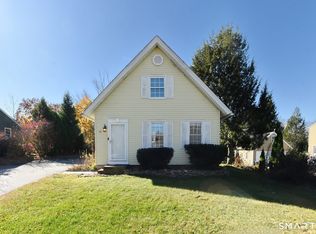 MLS ID #24219490, Jim A. Harrington, Carl Guild & Associates. Smart MLS
- $--3 bd1 ba920 sqft392 Mansfield Ave, Willimantic, CT 06226Auction
 Xome
- $149,9003 bd1 ba1k sqft859 Old Colchester Road, Montville, CT 06370For Sale
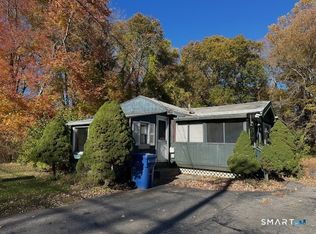 MLS ID #24216050, Erin Pepas, RE/MAX on the Bay. Smart MLS
- $200,0002 bd1 ba1k sqft40 Beech Street, Norwich, CT 06360For SaleMLS ID #24149517, Mark Mermelstein, eXp Realty. Smart MLS
- $150,0003 bd1 ba1.1k sqft216 Route 163, Montville, CT 06382For SaleMLS ID #24218787, Lu-Ann Perkins, RE/MAX on the Bay. Smart MLS
- $224,9003 bd2 ba1.3k sqft213 Laurel Hill Avenue, Norwich, CT 06360For SaleMLS ID #24206116, Kara A. Mazzola, First Choice Realty. Smart MLS
- $200,0002 bd2 ba1k sqft112 Colchester Commons, Colchester, CT 06415For SaleMLS ID #24205224, Sandra L. Lindstrom, Carl Guild & Associates. Smart MLS
- $264,9252 bd2 ba1k sqft51 North Cliff Street, Norwich, CT 06360For SaleMLS ID #24219827, Maria Pirulli, Five Stars Realty. Smart MLS
- $198,0002 bd1 ba864 sqftRidgewood Hills, Deep River, CT 06417For SaleMLS ID #24218651, Lisa Genovali, Re/Max Valley Shore. Smart MLS
- $280,0002 bd1 ba1.1k sqft5 Joe Williams Road, East Haddam, CT 06469For SaleMLS ID #24162353, Sharon Sirois, Showcase Realty, Inc.. Smart MLS
- $217,5004 bd1 ba1k sqft129 Walnut Street, Windham, CT 06226For SaleMLS ID #24213182, Lisa M. Therecka, Therecka & Associates LLC. Smart MLS
- $252,5003 bd1 ba1.2k sqft92 Water Street, Chester, CT 06412For SaleMLS ID #24198196, Ryan J. O'Keeffe, Salzillo Realty Company. Smart MLS
- $179,0002 bd2 ba1.1k sqftHamlin Court, Middletown, CT 06457For SaleMLS ID #24219890, Wally Namane, Keller Williams Realty Prtnrs.. Smart MLS
- $160,0001 bd1 ba700 sqft20 Terrace Boulevard, Norwich, CT 06360For SaleMLS ID #24215417, Ryan Braunagel, Keller Williams Realty Prtnrs.. Smart MLS
- $275,0003 bd1 ba1.2k sqft92 Pine Street, Columbia, CT 06237For SaleMLS ID #24197089, Mac A. McCorrison, McCorrison DW Fish Real Estate. Smart MLS
- $212,0002 bd2 ba1.1k sqftWellswood Estates, Hebron, CT 06231For SaleMLS ID #24217274, Kathy Dubay, I.M.A. Realty LLC. Smart MLS
- $284,9002 bd1 ba800 sqft38 Farm Hill Rd Road, Middletown, CT 06457For SaleMLS ID #24217053, Benjamin T. Zupan, William Raveis Real Estate. Smart MLS
- $230,0003 bd2 ba1.3k sqft20 Whitaker Avenue, Norwich, CT 06360For SaleMLS ID #24172390, Michelle Giroux, CENTURY 21 Shutters & Sails. Smart MLS
