$234,200
3 bd|1 ba|1.4k sqft
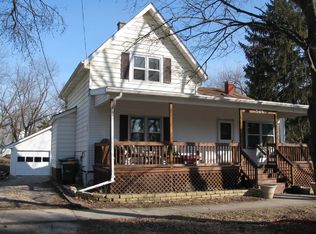
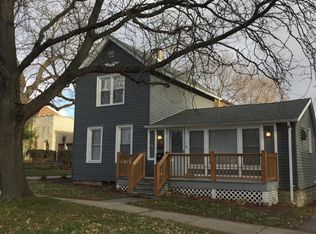
516 S Jefferson St, Lockport, IL 60441
Off Market
Likely to sell faster than
Zillow last checked:
Listing updated:
George Kolar, ABR,SRES (630)479-1400,
eXp Realty
Not available
Estimated sales range
Not available
Not available
| Date | Event | Price |
|---|---|---|
| 6/2/2026 | Contingent | $285,000$224/sqft |
Source: MRED as distributed by MLS GRID #12660347 Report a problem | ||
| 5/28/2026 | Listed for sale | $285,000+26.7%$224/sqft |
Source: | ||
| 3/21/2022 | Sold | $225,000+80%$176/sqft |
Source: | ||
| 1/29/2015 | Listing removed | $1,500$1/sqft |
Source: CENTURY 21 Affiliated #08753963 Report a problem | ||
| 12/18/2014 | Sold | $125,000$98/sqft |
Source: Public Record Report a problem | ||
| 12/7/2014 | Listed for rent | $1,500$1/sqft |
Source: CENTURY 21 Affiliated #08753963 Report a problem | ||
| 8/28/2014 | Pending sale | $125,000$98/sqft |
Source: CENTURY 21 Affiliated #08590700 Report a problem | ||
| 7/30/2014 | Price change | $125,000-3.8%$98/sqft |
Source: CENTURY 21 Affiliated #08590700 Report a problem | ||
| 7/9/2014 | Pending sale | $130,000$102/sqft |
Source: CENTURY 21 Affiliated #08590700 Report a problem | ||
| 5/11/2014 | Price change | $130,000-3.7%$102/sqft |
Source: CENTURY 21 Affiliated #08590700 Report a problem | ||
| 4/22/2014 | Listed for sale | $135,000+17.4%$106/sqft |
Source: Century 21 Pro-Team #08590700 Report a problem | ||
| 5/21/2010 | Sold | $115,000-5.7%$90/sqft |
Source: Public Record Report a problem | ||
| 3/6/2010 | Listed for sale | $121,900+31.3%$96/sqft |
Source: foreclosure.com Report a problem | ||
| 12/21/2009 | Sold | $92,835-49.4%$73/sqft |
Source: Public Record Report a problem | ||
| 5/11/2005 | Sold | $183,500+45.6%$144/sqft |
Source: Public Record Report a problem | ||
| 10/9/2002 | Sold | $126,000+5%$99/sqft |
Source: Public Record Report a problem | ||
| 9/15/1999 | Sold | $120,000+15.4%$94/sqft |
Source: Public Record Report a problem | ||
| 12/18/1995 | Sold | $104,000$82/sqft |
Source: Public Record Report a problem | ||
| Year | Property taxes | Tax assessment |
|---|---|---|
| 2024 | $4,261 -6.3% | $73,109 +11.4% |
| 2023 | $4,547 +1.5% | $65,633 +12.2% |
| 2022 | $4,482 -1.8% | $58,509 +6.4% |
| 2021 | $4,566 +2.8% | $54,985 +3.4% |
| 2020 | $4,441 +5.6% | $53,177 +5.5% |
| 2019 | $4,205 +6.8% | $50,404 +8.2% |
| 2018 | $3,938 +9.2% | $46,596 +10.2% |
| 2017 | $3,607 +7.2% | $42,297 +8.4% |
| 2016 | $3,366 -9.1% | $39,017 -5.8% |
| 2015 | $3,703 | $41,408 +4% |
| 2014 | $3,703 -0.5% | $39,816 -2% |
| 2013 | $3,721 -12.9% | $40,628 -18% |
| 2012 | $4,274 -4.3% | $49,547 -12% |
| 2011 | $4,466 -0.5% | $56,303 -8.3% |
| 2010 | $4,488 +0.2% | $61,425 -6% |
| 2009 | $4,479 +0.6% | $65,346 |
| 2008 | $4,452 | $65,346 +3.5% |
| 2007 | -- | $63,106 +9% |
| 2006 | $4,153 +3.4% | $57,895 +5.6% |
| 2005 | $4,015 +12.1% | $54,820 +18% |
| 2004 | $3,582 +0.5% | $46,458 +5.1% |
| 2003 | $3,564 +5.9% | $44,208 +7.8% |
| 2002 | $3,366 +7.7% | $41,012 +2% |
| 2001 | $3,124 +20.2% | $40,200 +11.2% |
| 2000 | $2,598 | $36,161 |
Find assessor info on the county website
Source: MRED as distributed by MLS GRID. This data may not be complete. We recommend contacting the local school district to confirm school assignments for this home.
A local agent can set up tours, give advice and negotiate with sellers.
A local lender can help you make sure your offer is ready when you are.