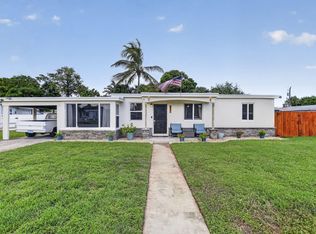
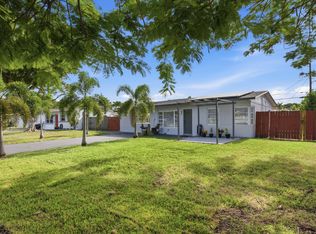
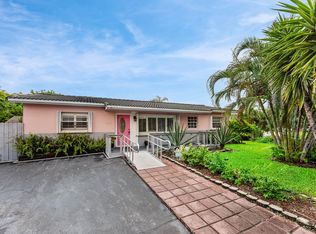
$429,000
2 bd2 ba1.3k sqft
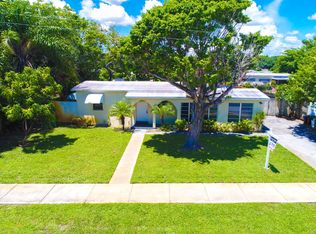
5247 NE 19th Ter, Pompano Beach, FL 33064
For Sale
Likely to sell faster than
Zillow last checked:
Listing updated:
Joshua Stanley 954-793-8673,
LoKation
 Originating MLS: BeachesMLS
$470,700
$447,000 - $494,000
$3,954/mo
| Date | Event | Price |
|---|---|---|
| 10/5/2026 | Listed for sale | $485,000+3.2%$376/sqft |
Source:  BeachesMLS #B26083266 Report a problem | ||
| 10/30/2025 | Listing removed | $470,000$365/sqft |
Source: BeachesMLS #F10507486 Report a problem | ||
| 9/17/2025 | Price change | $3,700-3.9%$3/sqft |
Source: BeachesMLS #F10523206 Report a problem | ||
| 9/9/2025 | Price change | $3,850-3.8%$3/sqft |
Source: BeachesMLS #F10523206 Report a problem | ||
| 8/25/2025 | Listed for rent | $4,000+0.8%$3/sqft |
Source: BeachesMLS #F10523206 Report a problem | ||
| 8/9/2025 | Listing removed | $3,970$3/sqft |
Source: Zillow Rentals Report a problem | ||
| 7/26/2025 | Listed for rent | $3,970+4.5%$3/sqft |
Source: Zillow Rentals Report a problem | ||
| 7/17/2025 | Price change | $470,000-2.1%$365/sqft |
Source: BeachesMLS #F10507486 Report a problem | ||
| 6/10/2025 | Listed for sale | $480,000+52.4%$372/sqft |
Source: BeachesMLS #F10507486 Report a problem | ||
| 9/12/2024 | Sold | $315,000-35.6%$244/sqft |
Source: Public Record Report a problem | ||
| 11/1/2023 | Listing removed | -- |
Source: BeachesMLS #F10400681 Report a problem | ||
| 10/24/2023 | Price change | $489,000-2%$379/sqft |
Source: BeachesMLS #F10399790 Report a problem | ||
| 10/10/2023 | Price change | $499,000-4%$387/sqft |
Source: BeachesMLS #F10399790 Report a problem | ||
| 10/3/2023 | Price change | $3,800-9.5%$3/sqft |
Source: BeachesMLS #F10400681 Report a problem | ||
| 9/19/2023 | Listed for rent | $4,200+134%$3/sqft |
Source: BeachesMLS #F10400681 Report a problem | ||
| 9/18/2023 | Price change | $520,000-5.5%$403/sqft |
Source: BeachesMLS #F10399790 Report a problem | ||
| 9/13/2023 | Listed for sale | $550,000+59.4%$427/sqft |
Source: BeachesMLS #F10399790 Report a problem | ||
| 6/16/2023 | Sold | $345,000-7.8%$268/sqft |
Source:  MIAMI #A11378915 Report a problem | ||
| 5/16/2023 | Contingent | $374,000$290/sqft |
Source: MIAMI #A11378915 Report a problem | ||
| 4/28/2023 | Listed for sale | $374,000-1.6%$290/sqft |
Source: MIAMI #A11378915 Report a problem | ||
| 4/26/2023 | Listing removed | -- |
Source: MIAMI #A11227449 Report a problem | ||
| 6/23/2022 | Listed for sale | $380,000+300%$295/sqft |
Source: MIAMI #A11227449 Report a problem | ||
| 1/14/2020 | Listing removed | $1,795$1/sqft |
Source: Wharton Realty Group, LLC #A10751209 Report a problem | ||
| 11/22/2019 | Listed for rent | $1,795$1/sqft |
Source: Wharton Realty Group, LLC #A10751209 Report a problem | ||
| 6/7/2012 | Sold | $95,000+53.2%$74/sqft |
Source: Public Record Report a problem | ||
| 9/15/2010 | Sold | $62,000-76.6%$48/sqft |
Source: Public Record Report a problem | ||
| 12/14/2005 | Sold | $265,000+82.8%$206/sqft |
Source: Public Record Report a problem | ||
| 6/26/2002 | Sold | $145,000+110.1%$112/sqft |
Source: Public Record Report a problem | ||
| 2/11/2002 | Sold | $69,000+25.5%$54/sqft |
Source: Public Record Report a problem | ||
| 7/1/1998 | Sold | $55,000$43/sqft |
Source: Public Record Report a problem | ||
| Year | Property taxes | Tax assessment |
|---|---|---|
| 2025 | $7,686 +2.1% | $359,360 +2.4% |
| 2024 | $7,526 +25.2% | $350,970 +56.6% |
| 2023 | $6,014 +18.6% | $224,140 +10% |
| 2022 | $5,070 +12.8% | $203,770 +10% |
| 2021 | $4,494 +11.6% | $185,250 +10% |
| 2020 | $4,028 +6% | $168,410 +10% |
| 2019 | $3,800 | $153,100 -20.7% |
| 2018 | $3,800 +13% | $193,130 +52.6% |
| 2017 | $3,361 +16.2% | $126,540 +10% |
| 2016 | $2,892 +9.6% | $115,040 +10% |
| 2015 | $2,640 +19.9% | $104,590 +10% |
| 2014 | $2,202 | $95,090 +10% |
| 2013 | $2,202 +84.5% | $86,450 +72.5% |
| 2012 | $1,194 -16.5% | $50,130 -19.9% |
| 2011 | $1,430 -43.8% | $62,550 -45.5% |
| 2010 | $2,543 -31.4% | $114,800 -35% |
| 2009 | $3,708 -21.2% | $176,680 -25.6% |
| 2008 | $4,707 -7.5% | $237,340 -7.9% |
| 2007 | $5,090 +5.5% | $257,590 +15.7% |
| 2006 | $4,827 | $222,600 +77.4% |
| 2005 | -- | $125,450 +3% |
| 2004 | $2,385 -33.3% | $121,800 |
| 2003 | $3,577 +68.3% | $121,800 +93.8% |
| 2002 | $2,126 | $62,860 |
Source: BeachesMLS. This data may not be complete. We recommend contacting the local school district to confirm school assignments for this home.

A local agent can set up tours, give advice and negotiate with sellers.
A local lender can help you make sure your offer is ready when you are.