Fully remodeled. This property is rented out to 3 long term tenants and generates $5,900.00/month in rental income. $70,800/year in rental income.
For sale
Price increase: $20K (10/20)
$700,000
5413 SW 23rd St, Hollywood, FL 33023
5beds
2,454sqft
Single Family Residence
Built in 1970
7,192 Square Feet Lot
$693,300 Zestimate®
$285/sqft
$-- HOA
What's special
Fully remodeled
- 14 days
- 2,184
- 329
Likely to sell faster than
Zillow last checked:
Listing updated:
Listed by:
Pablo Ramirez 786-202-3720,
Top Tier International Realty, LLC.
Source: MIAMI,MLS#: A12101884 Originating MLS: A-Miami Association of REALTORS
Facts & features
Interior
Bedrooms & bathrooms
- Bedrooms: 5
- Bathrooms: 4
- Full bathrooms: 4
Rooms
- Room types: Den/Library/Office
Heating
- None
Cooling
- Central Air
Appliances
- Included: Dishwasher, Electric Range, Microwave, Refrigerator
Features
- Flooring: Other
- Doors: High Impact Doors
Interior area
- Total structure area: 2,734
- Total interior livable area: 2,454 sqft
Video & virtual tour
Property
Parking
- Parking features: Driveway
- Has uncovered spaces: Yes
Features
- Stories: 2
- Entry location: First Floor Entry
- Patio & porch: Patio
- Exterior features: Room For Pool
- Pool features: R30-No Pool/No Water
- View description: None
Lot
- Size: 7,192 Square Feet
- Features: Less Than 1/4 Acre Lot
Details
- Parcel number: 514219023080
- Zoning: R-1C
Construction
Type & style
- Home type: SingleFamily
- Property subtype: Single Family Residence
Materials
- CBS Construction
- Roof: Shingle
Condition
- Year built: 1970
Utilities & green energy
- Sewer: Public Sewer
- Water: Municipal Water
Community & HOA
Community
- Features: None, No Subdiv/Park Info
- Subdivision: Carver Ranches Rev Plat
HOA
- Has HOA: No
Location
- Region: Hollywood
Financial & listing details
- Price per square foot: $285/sqft
- Tax assessed value: $357,500
- Annual tax amount: $7,338
- Date on market: 10/6/2026
- Listing terms: All Cash,Conventional,FHA
Estimated market value
$693,300
$659,000 - $728,000
$4,826/mo
Price history
| Date | Event | Price |
|---|---|---|
| 10/20/2026 | Price change | $700,000+2.9%$285/sqft |
Source:  MIAMI #A12101884 Report a problem | ||
| 10/9/2026 | Price change | $680,000+70%$277/sqft |
Source: MIAMI #A12101884 Report a problem | ||
| 10/6/2026 | Listed for sale | $400,000-42.9%$163/sqft |
Source: MIAMI #A12101884 Report a problem | ||
| 9/25/2026 | Listing removed | $700,000$285/sqft |
Source: MIAMI #A12093919 Report a problem | ||
| 9/22/2026 | Listed for sale | $700,000+9.4%$285/sqft |
Source: MIAMI #A12093919 Report a problem | ||
| 2/17/2026 | Listing removed | $1,500$1/sqft |
Source: Zillow Rentals Report a problem | ||
| 2/2/2026 | Listed for rent | $1,500$1/sqft |
Source: Zillow Rentals Report a problem | ||
| 10/17/2025 | Sold | $640,000-1.4%$261/sqft |
Source: MIAMI #A11866990 Report a problem | ||
| 10/7/2025 | Pending sale | $649,000$264/sqft |
Source: MIAMI #A11866990 Report a problem | ||
| 9/14/2025 | Price change | $649,000-3%$264/sqft |
Source: MIAMI #A11866990 Report a problem | ||
| 8/28/2025 | Listed for sale | $669,000+87.1%$273/sqft |
Source: MIAMI #A11866990 Report a problem | ||
| 3/12/2025 | Sold | $357,500-29.8%$146/sqft |
Source: MIAMI #A11717105 Report a problem | ||
| 2/28/2025 | Pending sale | $508,999$207/sqft |
Source: MIAMI #A11717105 Report a problem | ||
| 1/25/2025 | Price change | $508,9990%$207/sqft |
Source: MIAMI #A11717105 Report a problem | ||
| 1/16/2025 | Price change | $509,000-0.1%$207/sqft |
Source: MIAMI #A11717105 Report a problem | ||
| 1/10/2025 | Price change | $509,500-0.1%$208/sqft |
Source: MIAMI #A11717105 Report a problem | ||
| 1/3/2025 | Listed for sale | $510,000$208/sqft |
Source: MIAMI #A11717105 Report a problem | ||
Public tax history
| Year | Property taxes | Tax assessment |
|---|---|---|
| 2025 | $7,644 -29.5% | $357,500 -29.4% |
| 2024 | $10,843 +585.7% | $506,710 +379.5% |
| 2023 | $1,581 -7.7% | $105,670 +3% |
| 2022 | $1,714 +3.1% | $102,600 +3% |
| 2021 | $1,662 +1% | $99,620 +1.4% |
| 2020 | $1,645 +0.2% | $98,250 +2.3% |
| 2019 | $1,643 | $96,050 +1.9% |
| 2018 | $1,643 +8% | $94,260 +2.1% |
| 2017 | $1,522 +3.4% | $92,330 +2.1% |
| 2016 | $1,471 -0.8% | $90,440 +0.7% |
| 2015 | $1,484 -0.8% | $89,820 +0.8% |
| 2014 | $1,495 | $89,110 -17% |
| 2013 | $1,495 +4.5% | $107,390 +24.4% |
| 2012 | $1,431 +1% | $86,340 -20.8% |
| 2011 | $1,417 +3.6% | $109,050 +27.8% |
| 2010 | $1,367 +10.5% | $85,340 +2.7% |
| 2009 | $1,238 +1.3% | $83,100 +0.1% |
| 2008 | $1,222 -22.7% | $83,020 +3% |
| 2007 | $1,581 +14.5% | $80,610 +2.5% |
| 2006 | $1,382 | $78,650 +3% |
| 2005 | -- | $76,360 +3% |
| 2004 | $1,669 0% | $74,140 +1.9% |
| 2003 | $1,670 +0.7% | $72,760 +2.4% |
| 2002 | $1,659 +1.6% | $71,060 +1.6% |
| 2001 | $1,632 +5.4% | $69,950 |
| 2000 | $1,548 | -- |
Find assessor info on the county website
Monthly payment
Est. payment
Payment breakdown
Explore the cost of this home by adjusting the details. Changes won't be saved.Climate risks
Neighborhood: 33023
Nearby schools
Schools provided by the listing agent
- Elementary: Watkins
- Middle: Mcnicol
- High: Hallandale High
Source: MIAMI. This data may not be complete. We recommend contacting the local school district to confirm school assignments for this home.


Similar homes
- $649,0004 bd3 ba1.5k sqftMiami Gardens Estates Sec, Hollywood, FL 33023For Sale
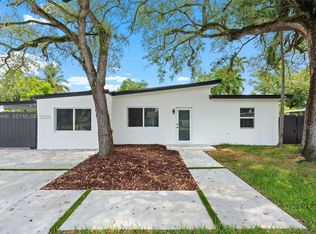
 MLS ID #A12060446, Dominic Rivera, Pine River Realty, LLC.. MIAMI
- $699,0003 bd2 ba1.9k sqftHollywood Hills, Hollywood, FL 33021For Sale
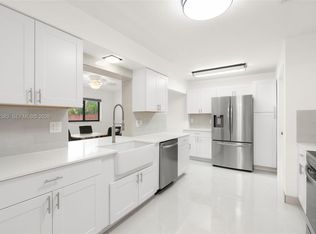 MLS ID #A12102383, Laura Zelnick, LoKation. MIAMI
- $610,0005 bd3 ba1.9k sqftMiramar Sec 9, Hollywood, FL 33023For Sale
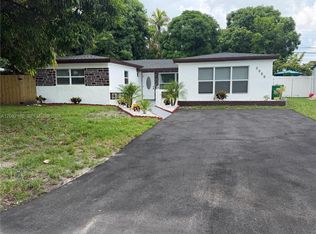 MLS ID #A12082180, Louvens Fils-Aime, Realty Hub. MIAMI
- $570,0004 bd2 ba1.4k sqftBoulevard Heights Sec Ten, Pembroke Pines, FL 33023For Sale
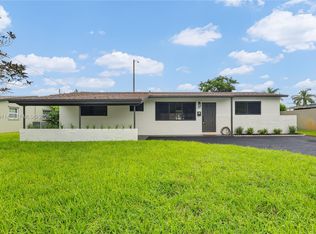 MLS ID #A12099114, Nicole Salgado, Cardinal Realty Group, LLC.. MIAMI
- $839,0004 bd4 ba2.2k sqftHollywood Hills 6-22 B, Hollywood, FL 33021For SaleMLS ID #A12098500, Steven Koleno, Beycome of Florida LLC. MIAMI
- $879,9904 bd4 ba3k sqftMiami Gardens Estates Sec, Hollywood, FL 33023New ConstructionMLS ID #A12030443, Suresh Chiatar, Compass Florida, LLC. MIAMI
- $699,0003 bd2 ba1.4k sqftGulfstream Estates No 2, Hallandale, FL 33009For SaleMLS ID #A12087064, Cristina Lopez, Optimar International Realty. MIAMI
- $709,9993 bd2 ba1.2k sqft1st Addn To Panuleta Gard, North Miami Beach, FL 33162For SaleMLS ID #A12099852, Kevares Morgan, Superior Realty Group LLC. MIAMI
- $649,9005 bd3 ba2.5k sqftBunche Park 1 Addn, Miami Gardens, FL 33054For SaleMLS ID #A12079950, Vladimir Guia Robaina, Realty One Group Evolution. MIAMI
- $749,0004 bd2 ba1.6k sqftHollywood Hills, Hollywood, FL 33021For SaleMLS ID #A12080752, Joseph Brikman, Real Broker, LLC. MIAMI
- $680,0004 bd2 ba1.5k sqftAlhambra Heights, North Miami, FL 33168For SaleMLS ID #A12081996, Lanorris Miller, Elite Realty Partners, Inc.. MIAMI
- $699,0004 bd3 ba2.1k sqftMarshall Court, Fort Lauderdale, FL 33317New ConstructionMLS ID #A12098160, Andrea Olarte, Phantom Real Estate. MIAMI
- $715,0004 bd2 ba1.4k sqftSun Ray Homes Greynolds P, North Miami Beach, FL 33179For SaleMLS ID #A12072689, Joseph Brikman, Real Broker, LLC. MIAMI
- $795,0003 bd3 ba1.7k sqftEmerald Pointe, Hollywood, FL 33021For SaleMLS ID #A12099022, Adi Gal, Sell It Realty, LLC.. MIAMI
- $828,0003 bd3 ba1.5k sqftHollywood Hills Amen Plat, Hollywood, FL 33021For SaleMLS ID #A12084788, Michael LaChance, LoKation. MIAMI
- $649,9003 bd3 ba1.4k sqftHollywood Terrace, Hollywood, FL 33020For SaleMLS ID #A12089414, Andres Barboza, Florida Realty of Miami Corp. MIAMI
- $639,0003 bd2 ba1.3k sqftLakeview Heights No 2, Hollywood, FL 33021For SaleMLS ID #A11984870, Lidia Mara, Best Invest Florida Realty LLC. MIAMI
- $579,0003 bd2 ba1.9k sqftBoulevard Heights Sec 1, Hollywood, FL 33024For SaleMLS ID #A12071432, Claudia Willard, Willard Realty Team Corp. MIAMI
- $675,0003 bd2 ba1.4k sqft1844 Sheridan Street, Hollywood, FL 33020For Sale
 MLS ID #B26045113, Kar Wai Chu, LoKation. BeachesMLS
