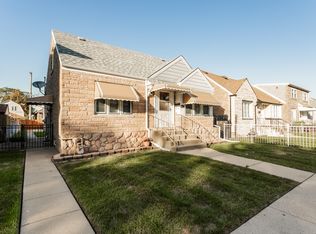
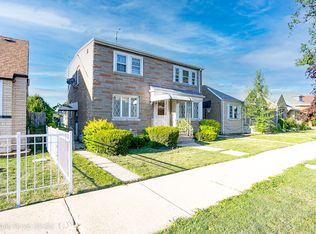
Fabulous Cape Cod in popular Clearing neighborhood! Floor Plan allows for nice entertaining flow. 3 bedrooms and 2 full updated baths spread out on 2 levels plus full basement. Nicely sized living and dining rooms, with easy access to kitchen. Hardwood flooring, charming built in drawers and plenty of closets & storage thru out. Family room in FULL FINISHED basement and separate utility space and dedicated Laundry Room. Soundproof windows courtesy of Midway Airport Sound Insulation Program. Newer mechanicals (water heater, central AC). Huge backyard on an oversized lot. Top it off with a $1000 Closing Credit from the Seller--Welcome Home!
Foreclosed
Est. $290,000
5440 W 64th St, Chicago, IL 60638
3beds
1,819sqft
SingleFamily
Built in 1942
5,000 Square Feet Lot
$-- Zestimate®
$159/sqft
$-- HOA
Overview
- 130 days |
- 180 |
- 23 |
Facts & features
Interior
Bedrooms & bathrooms
- Bedrooms: 3
- Bathrooms: 2
- Full bathrooms: 2
Heating
- Forced air, Gas
Cooling
- Central
Appliances
- Included: Dishwasher, Range / Oven, Refrigerator
Features
- Flooring: Tile, Hardwood
- Basement: Finished
Interior area
- Total interior livable area: 1,819 sqft
Property
Parking
- Total spaces: 2
- Parking features: None
Features
- Exterior features: Brick
Lot
- Size: 5,000 Square Feet
Details
- Parcel number: 1921107056
Construction
Type & style
- Home type: SingleFamily
Materials
- Frame
- Roof: Asphalt
Condition
- Year built: 1942
Utilities & green energy
- Sewer: Sewer-Public
Community & HOA
Location
- Region: Chicago
Financial & listing details
- Price per square foot: $159/sqft
- Tax assessed value: $290,000
Visit our professional directory to find a foreclosure specialist in your area that can help with your home search.
Find a foreclosure agentForeclosure details
Estimated market value
Not available
Estimated sales range
Not available
$2,611/mo
Price history
| Date | Event | Price |
|---|---|---|
| 9/4/2019 | Listing removed | $249,000$137/sqft |
Source: Dream Town Realty #10439085 Report a problem | ||
| 7/3/2019 | Listed for sale | $249,000+27.7%$137/sqft |
Source: Dream Town Realty #10439085 Report a problem | ||
| 8/30/2016 | Sold | $195,000+3.2%$107/sqft |
Source: | ||
| 8/17/2016 | Pending sale | $189,000$104/sqft |
Source: CENTURY 21 S.G.R., Inc. #09279263 Report a problem | ||
| 7/18/2016 | Listed for sale | $189,000$104/sqft |
Source: CENTURY 21 S.G.R., Inc. #09279263 Report a problem | ||
| 7/15/2016 | Pending sale | $189,000$104/sqft |
Source: CENTURY 21 S.G.R., Inc. #09279263 Report a problem | ||
| 7/8/2016 | Listed for sale | $189,000+5.1%$104/sqft |
Source: CENTURY 21 S.G.R., Inc. #09279263 Report a problem | ||
| 12/12/2014 | Listing removed | $179,900$99/sqft |
Source: CENTURY 21 McMullen Real Estate, Inc. #08690375 Report a problem | ||
| 8/3/2014 | Listed for sale | $179,900+5.8%$99/sqft |
Source: Century 21 McMullen #8690375 Report a problem | ||
| 7/30/2007 | Sold | $170,000-29.8%$93/sqft |
Source: | ||
| 8/26/2005 | Sold | $242,000+116.1%$133/sqft |
Source: Public Record Report a problem | ||
| 12/19/1995 | Sold | $112,000$62/sqft |
Source: Public Record Report a problem | ||
Public tax history
| Year | Property taxes | Tax assessment |
|---|---|---|
| 2024 | -- | $29,000 +31.8% |
| 2023 | $3,964 +3.1% | $22,000 |
| 2022 | $3,843 +2.4% | $22,000 |
| 2021 | $3,754 +4.5% | $22,000 +15% |
| 2020 | $3,593 -0.3% | $19,125 -10% |
| 2019 | $3,603 -14.7% | $21,250 |
| 2018 | $4,225 -0.8% | $21,250 +8.1% |
| 2017 | $4,260 +23.1% | $19,657 |
| 2016 | $3,460 +10% | $19,657 |
| 2015 | $3,144 +6% | $19,657 +6.7% |
| 2014 | $2,966 -12.2% | $18,429 |
| 2013 | $3,379 +1.3% | $18,429 |
| 2012 | $3,334 -18.9% | $18,429 -26.9% |
| 2011 | $4,113 -0.5% | $25,211 |
| 2010 | $4,132 +4.3% | $25,211 |
| 2009 | $3,963 +10.3% | $25,211 +1.4% |
| 2008 | $3,592 +0.9% | $24,851 |
| 2007 | $3,558 -1.1% | $24,851 |
| 2006 | $3,597 +47.9% | $24,851 +66.9% |
| 2005 | $2,433 +0.1% | $14,888 |
| 2004 | $2,431 +2.2% | $14,888 |
| 2003 | $2,379 +7.7% | $14,888 +22.3% |
| 2002 | $2,208 +3.7% | $12,170 |
| 2001 | $2,130 +14.8% | $12,170 |
| 2000 | $1,855 -0.7% | $12,170 +27.4% |
| 1999 | $1,868 | $9,556 |
Find assessor info on the county website
Monthly payment
Estimated monthly payment$1,822
All calculations are estimates and provided by Zillow, Inc. for informational purposes only. Actual amounts may vary.
HOA fees may include property taxes on listings classified as Co-Ops. Contact the listing agent and/or owner for fee details.
Mortgage interest rates are dependent on a number of factors, including credit score, down payment, and repayment length. Interest rate data provided by Zillow Group Marketplace, Inc. as of 1/1/1970 from various mortgage lenders with which we have lead or other similar arrangements; the Estimated Payment is an average of those rates.
See how much you could borrow to make a competitive offer.
Climate risks
Neighborhood: Clearing
Getting around
41 / 100
Some TransitNearby schools
GreatSchools rating
- 6/10Grimes Elementary SchoolGrades: PK-8Distance: 0.1 mi
- 1/10Kennedy High SchoolGrades: 9-12Distance: 1.5 mi


- Illinois
- Cook County
- Chicago
- 60638
- Clearing
- 5440 W 64th St
Nearby cities
Nearby neighborhoods
Nearby zip codes
Other Chicago Topics
