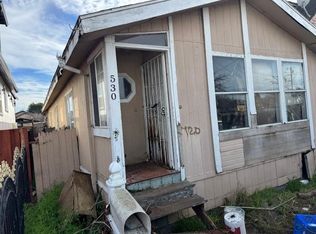
Tenant has been maintaining the home
Pending
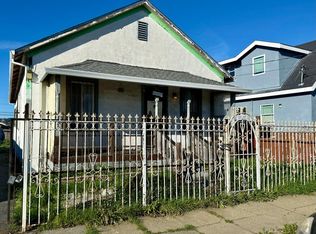
Street View
$385,000
545 3rd St, Richmond, CA 94801
4beds
1,483sqft
Single Family Residence
Built in 1914
2,613 Square Feet Lot
$378,200 Zestimate®
$260/sqft
$-- HOA
What's special
- 218 days |
- 8 |
- 0 |
Zillow last checked:
Listing updated:
Listed by:
Fred Valverde DRE #00713558 925-408-9060,
FRED VALVERDE, BROKER
Source: bridgeMLS/CCAR/Bay East AOR,MLS#: 41117920
Facts & features
Interior
Bedrooms & bathrooms
- Bedrooms: 4
- Bathrooms: 1
- Full bathrooms: 1
Rooms
- Room types: No Additional Rooms
Kitchen
- Features: Other
Heating
- Other
Cooling
- None
Appliances
- Laundry: Other
Features
- Flooring: Other
- Has fireplace: No
- Fireplace features: None
Interior area
- Total structure area: 1,483
- Total interior livable area: 1,483 sqft
Property
Parking
- Parking features: Off Street
Features
- Levels: One Story
- Stories: 1
- Exterior features: Other
- Pool features: None
Lot
- Size: 2,613 Square Feet
- Features: Level
Details
- Parcel number: 5342710315
- Special conditions: Offer As Is
- Other equipment: Other
Construction
Type & style
- Home type: SingleFamily
- Architectural style: Bungalow
- Property subtype: Single Family Residence
Materials
- Other
Condition
- Existing
- New construction: No
- Year built: 1914
Utilities & green energy
- Electric: No Solar
Community & HOA
HOA
- Has HOA: No
Location
- Region: Richmond
Financial & listing details
- Price per square foot: $260/sqft
- Tax assessed value: $198,060
- Annual tax amount: $5,226
- Date on market: 11/20/2025
- Listing terms: Cash
Estimated market value
$378,200
$340,000 - $420,000
$3,140/mo
Price history
| Date | Event | Price |
|---|---|---|
| 12/2/2025 | Pending sale | $385,000$260/sqft |
Source: | ||
| 11/20/2025 | Listed for sale | $385,000-16.3%$260/sqft |
Source: | ||
| 10/2/2025 | Listing removed | $460,000$310/sqft |
Source: | ||
| 7/30/2025 | Listed for sale | $460,000+1.1%$310/sqft |
Source: | ||
| 7/30/2025 | Listing removed | $455,000$307/sqft |
Source: | ||
| 5/27/2025 | Listed for sale | $455,000-1.1%$307/sqft |
Source: | ||
| 5/23/2025 | Listing removed | $460,000$310/sqft |
Source: | ||
| 2/12/2025 | Listed for sale | $460,000+1050%$310/sqft |
Source: | ||
| 5/13/2009 | Sold | $40,000-15.8%$27/sqft |
Source: Public Record Report a problem | ||
| 3/15/2009 | Listed for sale | $47,500-50.9%$32/sqft |
Source: foreclosure.com Report a problem | ||
| 2/3/2009 | Sold | $96,800-74.9%$65/sqft |
Source: Public Record Report a problem | ||
| 11/22/2005 | Sold | $385,000+61.8%$260/sqft |
Source: Public Record Report a problem | ||
| 6/15/2004 | Sold | $238,000$160/sqft |
Source: Public Record Report a problem | ||
Public tax history
| Year | Property taxes | Tax assessment |
|---|---|---|
| 2025 | $5,226 -6.1% | $198,060 +2% |
| 2024 | $5,563 +17.9% | $194,177 -0.6% |
| 2023 | $4,716 -10.3% | $195,420 +2% |
| 2022 | $5,257 +6.6% | $191,590 +2% |
| 2021 | $4,930 +5.8% | $187,834 +1% |
| 2020 | $4,658 +2.4% | $185,909 +2% |
| 2019 | $4,548 +3.6% | $182,264 +2% |
| 2018 | $4,389 +78.5% | $178,691 +302.7% |
| 2017 | $2,458 +2.8% | $44,377 +2% |
| 2016 | $2,393 +4.8% | $43,508 +1.5% |
| 2015 | $2,283 | $42,855 +2% |
| 2014 | $2,283 | $42,017 +0.5% |
| 2013 | -- | $41,828 +2% |
| 2012 | -- | $41,008 +2% |
| 2011 | -- | $40,204 +0.8% |
| 2010 | -- | $39,904 -0.2% |
| 2009 | -- | $40,000 -87.4% |
| 2008 | -- | $318,000 -19% |
| 2007 | -- | $392,700 +2% |
| 2006 | -- | $385,000 +58.6% |
| 2005 | -- | $242,760 +1502.7% |
| 2004 | -- | $15,147 +1.9% |
| 2003 | -- | $14,870 +2% |
| 2002 | -- | $14,579 +2% |
| 2001 | -- | $14,294 |
Find assessor info on the county website
Monthly payment
Est. payment$--/mo
Payment breakdown
Explore the cost of this home by adjusting the details. Changes won't be saved.All calculations are estimates and provided by Zillow, Inc. for informational purposes only. Actual amounts may vary.
HOA fees may include property taxes on listings classified as Co-Ops. Contact the listing agent and/or owner for fee details.
Mortgage interest rates are dependent on a number of factors, including credit score, down payment, and repayment length. Interest rate data provided by Zillow Group Marketplace, Inc. as of 1/1/1970 from various mortgage lenders with which we have lead or other similar arrangements; the Estimated Payment is an average of those rates.
See how much you could borrow to make a competitive offer.
Climate risks
Neighborhood: Iron Triangle
Nearby schools
GreatSchools rating
- 1/10Peres Elementary SchoolGrades: K-8Distance: 0.3 mi
- 3/10Richmond High SchoolGrades: 9-12Distance: 1.5 mi
- 1/10Helms Middle SchoolGrades: 7-8Distance: 2.2 mi
A local agent can set up tours, give advice and negotiate with sellers.


Local buyer's agents are ready to help
Nearby cities
Nearby neighborhoods
Nearby zip codes
Other Richmond Topics
