This 1242 square foot single family home has 2 bedrooms and 1.0 bathrooms. This home is located at 539 3rd St, Richmond, CA 94801.
Pre-foreclosure
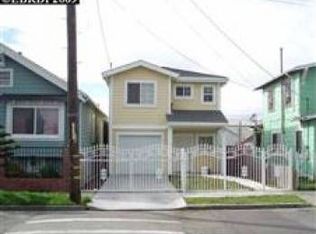
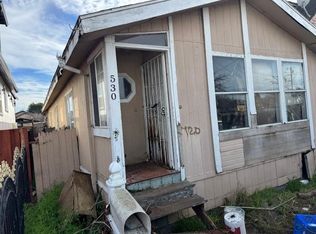
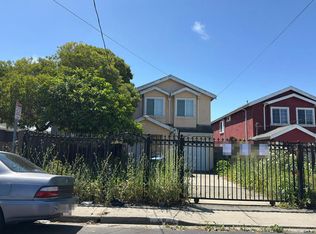
Street View
Est. $394,800
539 3rd St, Richmond, CA 94801
2beds
1baths
1,242sqft
SingleFamily
Built in 1904
5,096 Square Feet Lot
$394,800 Zestimate®
$318/sqft
$-- HOA
Overview
- 46 days |
- 7 |
- 0 |
Facts & features
Interior
Bedrooms & bathrooms
- Bedrooms: 2
- Bathrooms: 1
Interior area
- Total interior livable area: 1,242 sqft
Property
Lot
- Size: 5,096 Square Feet
Details
- Parcel number: 5342710323
Construction
Type & style
- Home type: SingleFamily
Condition
- Year built: 1904
Community & HOA
Location
- Region: Richmond
Financial & listing details
- Price per square foot: $318/sqft
- Tax assessed value: $322,524
- Annual tax amount: $6,099
Visit our professional directory to find a foreclosure specialist in your area that can help with your home search.
Find a foreclosure agentForeclosure details
Estimated market value
$394,800
$336,000 - $450,000
$2,834/mo
Price history
| Date | Event | Price |
|---|---|---|
| 5/7/2024 | Listing removed | -- |
Source: Zillow Rentals Report a problem | ||
| 5/2/2024 | Price change | $3,250+12.1%$3/sqft |
Source: Zillow Rentals Report a problem | ||
| 4/26/2024 | Listed for rent | $2,900$2/sqft |
Source: Zillow Rentals Report a problem | ||
| 9/22/2022 | Sold | $310,000+3.7%$250/sqft |
Source: | ||
| 8/31/2022 | Pending sale | $299,000$241/sqft |
Source: | ||
| 8/18/2022 | Listed for sale | $299,000$241/sqft |
Source: | ||
Public tax history
| Year | Property taxes | Tax assessment |
|---|---|---|
| 2025 | $6,099 +1.8% | $322,524 +2% |
| 2024 | $5,992 +1.4% | $316,200 +2% |
| 2023 | $5,907 +133.7% | $310,000 +245.5% |
| 2022 | $2,528 +2.9% | $89,736 +2% |
| 2021 | $2,455 +4.4% | $87,977 +1% |
| 2020 | $2,351 +2.9% | $87,076 +2% |
| 2019 | $2,286 +4.3% | $85,370 +2% |
| 2018 | $2,192 +3.5% | $83,697 +2% |
| 2017 | $2,118 +3.3% | $82,057 +2% |
| 2016 | $2,050 -1.6% | $80,449 +1.5% |
| 2015 | $2,083 | $79,242 +2% |
| 2014 | $2,083 | $77,690 +0.5% |
| 2013 | -- | $77,340 +12.9% |
| 2012 | -- | $68,500 +10.5% |
| 2011 | -- | $62,000 |
| 2010 | -- | $62,000 |
| 2009 | -- | $62,000 -14.5% |
| 2008 | -- | $72,512 +2% |
| 2007 | -- | $71,091 +2% |
| 2006 | -- | $69,698 +2% |
| 2005 | -- | $68,332 +2% |
| 2004 | -- | $66,993 +1.9% |
| 2003 | -- | $65,766 +23% |
| 2002 | -- | $53,477 +28.4% |
| 2001 | -- | $41,645 |
Find assessor info on the county website
Monthly payment
Estimated monthly payment$1,822
All calculations are estimates and provided by Zillow, Inc. for informational purposes only. Actual amounts may vary.
HOA fees may include property taxes on listings classified as Co-Ops. Contact the listing agent and/or owner for fee details.
Mortgage interest rates are dependent on a number of factors, including credit score, down payment, and repayment length. Interest rate data provided by Zillow Group Marketplace, Inc. as of 1/1/1970 from various mortgage lenders with which we have lead or other similar arrangements; the Estimated Payment is an average of those rates.
See how much you could borrow to make a competitive offer.
Climate risks
Neighborhood: Iron Triangle
Nearby schools
GreatSchools rating
- 1/10Peres Elementary SchoolGrades: K-8Distance: 0.3 mi
- 3/10Richmond High SchoolGrades: 9-12Distance: 1.5 mi
- 1/10Helms Middle SchoolGrades: 7-8Distance: 2.2 mi


Nearby cities
Nearby neighborhoods
Nearby zip codes
Other Richmond Topics
