Renovated in 2026, 545 Spruce Ct features a single-story layout with three bedrooms and two bathrooms. Fresh interior paint and updated flooring complement a living room fireplace, while the kitchen features new appliances and cabinet storage. A new HVAC system and fresh exterior paint add to the home's updates. Outside, the fenced backyard includes a patio, and the attached two-car garage provides covered parking and storage. Included 100-Day Home Warranty with buyer activation
For sale
Price cut: $6K (10/15)
$454,000
545 Spruce Ct, Palmdale, CA 93550
3beds
1,229sqft
Residential, Single Family Residence
Built in 1988
7,714 Square Feet Lot
$-- Zestimate®
$369/sqft
$-- HOA
What's special
- 23 days
- 1,031
- 60
Zillow last checked:
Listing updated:
Listed by:
Lisa Soltesz DRE # 02280080 480-462-5392,
Opendoor Brokerage Inc. 480-462-5392,
Rachel Griego DRE # 02231089 702-744-9890,
Opendoor Brokerage Inc.
Source: CLAW,MLS#: 26995975
Facts & features
Interior
Bedrooms & bathrooms
- Bedrooms: 3
- Bathrooms: 2
- Full bathrooms: 2
Heating
- Natural Gas
Cooling
- Other
Appliances
- Included: Range/Oven
- Laundry: Other
Features
- Flooring: Carpet, Tile
- Has fireplace: No
- Fireplace features: None
Interior area
- Total structure area: 1,229
- Total interior livable area: 1,229 sqft
Property
Parking
- Total spaces: 2
- Parking features: Attached
- Attached garage spaces: 2
Features
- Levels: One
- Stories: 1
- Pool features: None
- Spa features: None
- View description: None
Lot
- Size: 7,714 Square Feet
- Features: Cul-De-Sac
Details
- Additional structures: None
- Parcel number: 3010036086
- Zoning: PDMPD-RPD12U
- Special conditions: Standard
Construction
Type & style
- Home type: SingleFamily
- Property subtype: Residential, Single Family Residence
Condition
- Year built: 1988
Community & HOA
Community
- Security: Security System Owned
HOA
- Has HOA: No
- Amenities included: None
Location
- Region: Palmdale
Financial & listing details
- Price per square foot: $369/sqft
- Tax assessed value: $295,606
- Date on market: 10/2/2026
Estimated market value
Not available
Estimated sales range
Not available
Not available
Price history
| Date | Event | Price |
|---|---|---|
| 10/15/2026 | Price change | $454,000-1.3%$369/sqft |
Source:  CLAW #26995975 Report a problem | ||
| 10/2/2026 | Listed for sale | $460,000+5.5%$374/sqft |
Source: CLAW #26995975 Report a problem | ||
| 9/15/2026 | Sold | $436,000+64.5%$355/sqft |
Source: Public Record Report a problem | ||
| 12/27/2019 | Sold | $265,000+6%$216/sqft |
Source:  CRMLS #DW19226878 Report a problem | ||
| 12/3/2019 | Pending sale | $250,000$203/sqft |
Source: Executive Bankers Realty #DW19226878 Report a problem | ||
| 9/24/2019 | Listed for sale | $250,000+9.2%$203/sqft |
Source: Executive Bankers Realty #DW19226878 Report a problem | ||
| 5/17/2017 | Sold | $229,000+0%$186/sqft |
Source: Public Record Report a problem | ||
| 5/15/2017 | Pending sale | $228,888$186/sqft |
Source: Hall & Chambers #317001247 Report a problem | ||
| 5/15/2017 | Listed for sale | $228,888$186/sqft |
Source: Hall & Chambers #317001247 Report a problem | ||
| 3/15/2017 | Listing removed | $228,888$186/sqft |
Source: Hall & Chambers The Takle Group Report a problem | ||
| 3/7/2017 | Listed for sale | $228,888+140.9%$186/sqft |
Source: Hall & Chambers The Takle Group Report a problem | ||
| 5/20/2009 | Sold | $95,000+5.6%$77/sqft |
Source: Public Record Report a problem | ||
| 4/23/2009 | Listed for sale | $90,000-37.9%$73/sqft |
Source: foreclosure.com Report a problem | ||
| 8/27/2008 | Sold | $145,000-56.8%$118/sqft |
Source: Public Record Report a problem | ||
| 6/9/2006 | Sold | $336,000+110%$273/sqft |
Source: Public Record Report a problem | ||
| 6/10/2003 | Sold | $160,000+142.4%$130/sqft |
Source: Public Record Report a problem | ||
| 3/2/1999 | Sold | $66,000-43.3%$54/sqft |
Source: Public Record Report a problem | ||
| 8/4/1997 | Sold | $116,417$95/sqft |
Source: Public Record Report a problem | ||
Public tax history
| Year | Property taxes | Tax assessment |
|---|---|---|
| 2026 | -- | $295,606 +2% |
| 2025 | $5,065 +6% | $289,811 +2% |
| 2024 | $4,779 +0% | $284,129 +2% |
| 2023 | $4,776 +4.3% | $278,559 +2% |
| 2022 | $4,580 +1.6% | $273,098 +2% |
| 2021 | $4,507 +2.6% | $267,744 +1% |
| 2020 | $4,394 | $265,000 +11.2% |
| 2019 | $4,394 +14.2% | $238,251 +2% |
| 2018 | $3,848 | $233,580 +121.6% |
| 2017 | $3,848 +60.6% | $105,400 +2% |
| 2016 | $2,395 +4.9% | $103,334 +1.5% |
| 2015 | $2,283 +1.9% | $101,783 +2% |
| 2014 | $2,240 | $99,790 +2.5% |
| 2012 | -- | $97,393 +2% |
| 2011 | -- | $95,485 +12.1% |
| 2010 | -- | $85,200 -47.4% |
| 2009 | -- | $162,000 -45.7% |
| 2008 | -- | $298,600 -12.9% |
| 2007 | -- | $342,720 +102.1% |
| 2006 | -- | $169,569 |
| 2005 | -- | $169,569 +4% |
| 2004 | -- | $162,986 +115.1% |
| 2003 | -- | $75,766 +2% |
| 2002 | -- | $74,282 +4% |
| 2000 | -- | $71,400 |
Find assessor info on the county website
Monthly payment
Est. payment
Payment breakdown
Explore the cost of this home by adjusting the details. Changes won't be saved.Climate risks
Neighborhood: 93550

Similar homes
- $495,0003 bd2 ba1.5k sqft37510 Conifer Dr, Palmdale, CA 93550For Sale
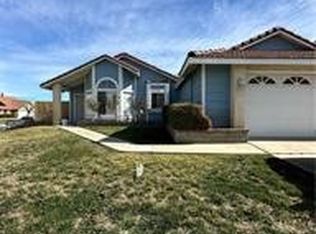 MLS ID #DW26212113, Marlene Rodriguez, M. R. & Associates. CRMLS
- $445,0003 bd2 ba1.4k sqft37672 Lasker Ave, Palmdale, CA 93550For Sale
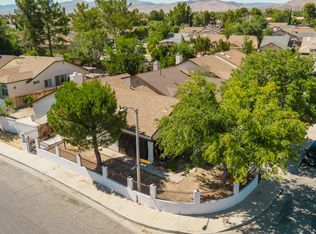 JohnHart Real Estate
- $399,9993 bd3 ba1.3k sqft1820 E Avenue R10, Palmdale, CA 93550For Sale
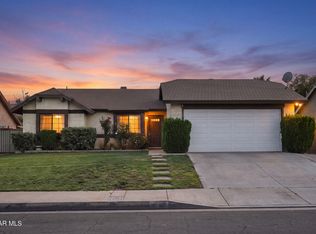 MLS ID #26008073, Walter Martinez. GAVAR
- $499,9003 bd2 ba1.4k sqft37925 Maureen St, Palmdale, CA 93550For Sale
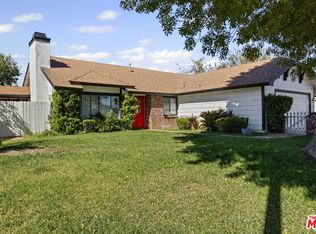 MLS ID #26102761, Jeffrey Sklar DRE # 02075404, Beycome Brokerage Realty Inc.. CLAW
