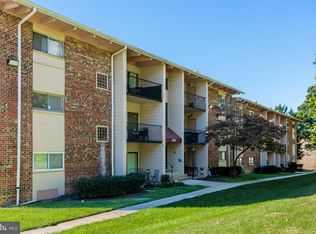
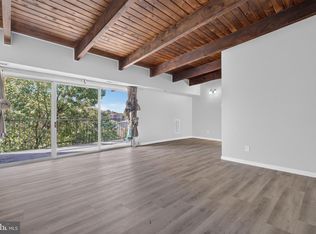
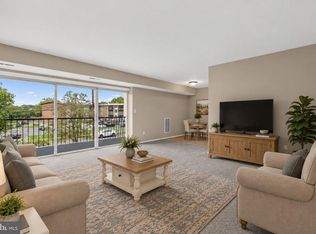
$128,500
1 bd1 ba650 sqft
5454 85th Ave APT 101, New Carrollton, MD 20784
Sold

Zillow last checked:
Listing updated:
Chandani Hangilipola 240-919-3281,
EXP Realty, LLC 8333357433

$154,100
$146,000 - $162,000
$1,410/mo
| Date | Event | Price |
|---|---|---|
| 10/14/2026 | Listed for sale | $159,000+38.3%$235/sqft |
Source:  Bright MLS #MDPG2222306 Report a problem | ||
| 6/12/2024 | Listing removed | -- |
Source: Zillow Rentals Report a problem | ||
| 6/3/2024 | Price change | $1,500-14.3%$2/sqft |
Source: Zillow Rentals Report a problem | ||
| 5/7/2024 | Price change | $1,750-5.4%$3/sqft |
Source: Zillow Rentals Report a problem | ||
| 4/22/2024 | Listed for rent | $1,850+12.1%$3/sqft |
Source: Zillow Rentals Report a problem | ||
| 3/22/2024 | Sold | $115,000$170/sqft |
Source: Bright MLS #MDPG2099634 Report a problem | ||
| 3/2/2024 | Listing removed | -- |
Source: Zillow Rentals Report a problem | ||
| 2/23/2024 | Contingent | $115,000$170/sqft |
Source: Bright MLS #MDPG2099634 Report a problem | ||
| 2/14/2024 | Listed for rent | $1,650$2/sqft |
Source: Zillow Rentals Report a problem | ||
| 1/10/2024 | Listing removed | -- |
Source: Zillow Rentals Report a problem | ||
| 1/5/2024 | Listed for sale | $115,000+155.6%$170/sqft |
Source: Bright MLS #MDPG2099634 Report a problem | ||
| 12/23/2023 | Listed for rent | $1,650$2/sqft |
Source: Zillow Rentals Report a problem | ||
| 3/6/2017 | Sold | $45,000+32.5%$67/sqft |
Source: Public Record Report a problem | ||
| 3/24/1994 | Sold | $33,950$50/sqft |
Source: Public Record Report a problem | ||
| Year | Property taxes | Tax assessment |
|---|---|---|
| 2026 | $2,038 | $110,000 +6.8% |
| 2025 | $2,038 +36.2% | $103,000 +7.3% |
| 2024 | $1,497 +6.5% | $96,000 +7.9% |
| 2023 | $1,406 -0.9% | $89,000 |
| 2022 | $1,419 +50.8% | $89,000 +52.6% |
| 2021 | $941 +33.3% | $58,333 +35.7% |
| 2020 | $706 +38.3% | $43,000 +25.2% |
| 2019 | $510 | $34,333 |
| 2018 | -- | $34,333 +14.4% |
| 2017 | $446 -78.5% | $30,000 +9.8% |
| 2016 | $2,070 | $27,333 +7.5% |
| 2015 | $2,070 | $25,433 +15.6% |
| 2014 | $2,070 | $22,000 |
| 2013 | -- | $22,000 |
| 2012 | -- | $22,000 -80% |
| 2011 | -- | $110,000 +12.6% |
| 2010 | -- | $97,666 +14.5% |
| 2009 | -- | $85,333 +16.9% |
| 2008 | -- | $73,000 +23% |
| 2007 | -- | $59,332 +29.9% |
| 2006 | -- | $45,666 +42.7% |
| 2005 | -- | $32,000 |
| 2004 | -- | $32,000 |
| 2003 | -- | $32,000 -5.7% |
| 2002 | -- | $33,950 |
| 2001 | -- | $33,950 |
Source: Bright MLS. This data may not be complete. We recommend contacting the local school district to confirm school assignments for this home.

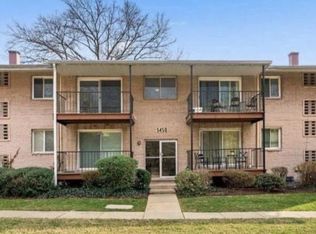
A local agent can set up tours, give advice and negotiate with sellers.