Great investment opportunity with room to add value! This home features 9-foot ceilings in the bedrooms, kitchen, and living areas, creating an open, spacious feel throughout. A few updates offer the chance to bring your vision to life and make the space your own. An appealing opportunity for investors or buyers looking to personalize their next home. Price negotiable!
For sale by owner
$125,000
5520 Section Ave, Cincinnati, OH 45212
2beds
1,290sqft
SingleFamily
Built in 1928
3,397 Square Feet Lot
$191,300 Zestimate®
$97/sqft
$-- HOA
What's special
Open spacious feel throughout
- 3 days
- 388
- 34
Listed by:
Property Owner (513) 295-3149
Facts & features
Interior
Bedrooms & bathrooms
- Bedrooms: 2
- Bathrooms: 1
- Full bathrooms: 1
Heating
- Baseboard
Cooling
- None
Features
- Basement: Partially finished
- Has fireplace: No
Interior area
- Total interior livable area: 1,290 sqft
Property
Parking
- Parking features: Garage - Detached
Features
- Exterior features: Other
Lot
- Size: 3,397 Square Feet
Details
- Parcel number: 6510002001300
Construction
Type & style
- Home type: SingleFamily
- Architectural style: Conventional
Materials
- Frame
Condition
- New construction: No
- Year built: 1928
Community & HOA
Location
- Region: Cincinnati
Financial & listing details
- Price per square foot: $97/sqft
- Tax assessed value: $125,500
- Annual tax amount: $3,812
- Date on market: 11/9/2026
Estimated market value
$191,300
$166,000 - $212,000
$1,644/mo
Price history
| Date | Event | Price |
|---|---|---|
| 11/9/2026 | Listed for sale | $125,000+52.4%$97/sqft |
Source: Owner Report a problem | ||
| 5/6/2026 | Sold | $82,000$64/sqft |
Source: Public Record Report a problem | ||
Public tax history
| Year | Property taxes | Tax assessment |
|---|---|---|
| 2025 | $3,812 +123.7% | $43,925 |
| 2024 | $1,704 -5% | $43,925 |
| 2023 | $1,794 +55.8% | -- |
| 2022 | $1,152 -14.9% | $27,440 |
| 2021 | $1,353 +21.2% | $27,440 |
| 2020 | $1,116 -5.4% | $27,440 +14% |
| 2019 | $1,180 +7.3% | $24,070 |
| 2018 | $1,099 +17.7% | $24,070 |
| 2017 | $934 +4% | $24,070 -3% |
| 2016 | $898 | $24,816 |
| 2015 | $898 -0.4% | $24,816 |
| 2014 | $901 -8.1% | $24,816 -6% |
| 2013 | $981 -0.3% | $26,401 |
| 2012 | $984 -32.3% | $26,401 |
| 2011 | $1,454 +5.6% | $26,401 -12.9% |
| 2010 | $1,377 +1.2% | $30,321 |
| 2009 | $1,360 +5.6% | $30,321 |
| 2008 | $1,287 +2.5% | $30,321 +5% |
| 2007 | $1,256 -2.8% | $28,875 |
| 2006 | $1,292 +5.8% | $28,875 |
| 2005 | $1,222 +20.5% | $28,875 +29.1% |
| 2003 | $1,014 +1.4% | $22,365 |
| 2002 | $1,000 +7.8% | $22,365 +16.4% |
| 2001 | $928 +3.5% | $19,215 |
| 2000 | $897 | $19,215 |
Find assessor info on the county website
Monthly payment
Est. payment
Payment breakdown
Explore the cost of this home by adjusting the details. Changes won't be saved.Climate risks
Neighborhood: 45212

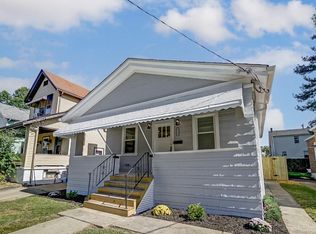
Similar homes
- $115,0002 bd2 ba1k sqft5721 Carthage Ave, Cincinnati, OH 45212For Sale
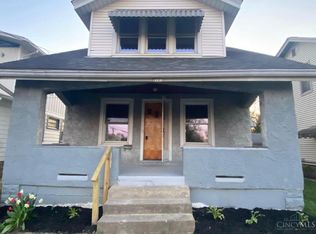
 MLS ID #1895834, Scott F Evans, RE/MAX United Associates. Cincy MLS
- $119,9003 bd1 ba1.1k sqft5110 Rolston Ave, Cincinnati, OH 45212For Sale
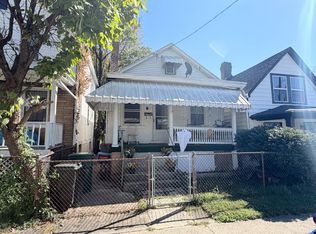 MLS ID #1897020, Tom Deutsch Jr., Coldwell Banker Realty. Cincy MLS
- $134,9003 bd1 ba1.2k sqft573 Flatt Ter, Cincinnati, OH 45232For Sale
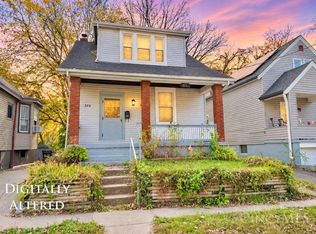 MLS ID #1900056, Gigi J Dales, Plum Tree Realty. Cincy MLS
- $--3 bd1 ba1.4k sqft5335 Grafton Ave, Cincinnati, OH 45237Auction
 Auction.com 2
- $129,0002 bd1 ba1.3k sqft1654 California Ave, Cincinnati, OH 45237For SaleMLS ID #1880236, Janice A Modarelli, Fathom Realty Ohio. Cincy MLS
- $128,9003 bd1 ba1k sqft5406 Charloe St, Cincinnati, OH 45227For SaleMLS ID #1899566, Robert M. Collins, eXp Realty. Cincy MLS
- $129,9002 bd1 ba985 sqft1105 Regent Ave, Cincinnati, OH 45237For SaleMLS ID #1896292, Timothy Settles, Trelora Realty, Inc. Cincy MLS
- $170,0003 bd1 ba1.2k sqft5608 Abbottsford St, Cincinnati, OH 45212For SaleMLS ID #1899623, Scott F Evans, RE/MAX United Associates. Cincy MLS
- $159,9002 bd2 ba1.5k sqft2054 Dale Rd, Cincinnati, OH 45212For SaleMLS ID #1887513, Matthew Kalogeras, Trelora Realty, Inc. Cincy MLS
- $109,0003 bd2 ba1.5k sqft107 W 65th St, Cincinnati, OH 45216For SaleMLS ID #1899655, Christopher Swain, Epique Inc.. Cincy MLS
- $164,9002 bd1 ba1.4k sqft2411 Highland Ave, Cincinnati, OH 45212For SaleMLS ID #1895953, Michael Mcgee, Mainstay Brokerage LLC. Cincy MLS
- $139,9003 bd2 ba1.6k sqft1803 Lawn Ave, Cincinnati, OH 45237For SaleMLS ID #1886230, Deandra Bryant, Trelora Realty, Inc. Cincy MLS
- $124,9002 bd1 ba989 sqft6814 Warder Dr, Cincinnati, OH 45224For SaleMLS ID #1894392, Michael Mcgee, Mainstay Brokerage LLC. Cincy MLS
- $149,9003 bd1 ba1.1k sqft1229 Madeleine Cir, Cincinnati, OH 45231For SaleMLS ID #1899909, Kaylie N. Mason, Keller Williams Seven Hills Re. Cincy MLS
- $165,0003 bd1 ba1.3k sqft17 Forest Ave, Cincinnati, OH 45220For SaleMLS ID #1899626, Sami K. Kassem, ERA REAL Solutions Realty. LLC. Cincy MLS
- $177,9003 bd1 ba1.1k sqft(Undisclosed Address), Cincinnati, OH 45212For SaleMLS ID #1868402, Bob R. Daniel, Keller Williams Advisors. Cincy MLS
- $164,9002 bd1 ba974 sqft1843 Dalewood Pl, Cincinnati, OH 45237For SaleMLS ID #1896027, Timothy Settles, Trelora Realty, Inc. Cincy MLS
