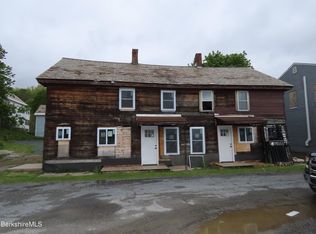
Come see this large 2-unit property today. Spacious units with open floorplans and 5 bedrooms total. Property has been gutted and is ready to be put back together. Bring your tools and your ideas.
Foreclosure
$74,900
56 Liberty St, North Adams, MA 01247
5beds
2,623sqft
Multi Family
Built in 1875
-- sqft lot
$-- Zestimate®
$29/sqft
$-- HOA
What's special
- 144 days |
- 1,383 |
- 56 |
Zillow last checked:
Listing updated:
Listed by:
Benjamin Hause 978-673-4802,
Keller Williams Realty North Central 978-840-9000
Source: MLS PIN,MLS#: 73475394
Loading...
Facts & features
Interior
Bedrooms & bathrooms
- Bedrooms: 5
- Bathrooms: 2
- Full bathrooms: 2
Features
- Has basement: No
- Has fireplace: No
Interior area
- Total structure area: 2,623
- Total interior livable area: 2,623 sqft
- Finished area above ground: 2,623
Property
Parking
- Total spaces: 2
- Uncovered spaces: 2
Lot
- Size: 10,488 Square Feet
- Features: Cleared
Details
- Parcel number: M:079 B:0000 L:63,2701124
- Zoning: 104
- Special conditions: Real Estate Owned
Construction
Type & style
- Home type: MultiFamily
- Property subtype: Multi Family
Materials
- Foundation: Stone, Brick/Mortar
Condition
- Year built: 1875
Utilities & green energy
- Sewer: Public Sewer
- Water: Public
Community & HOA
Location
- Region: North Adams
Financial & listing details
- Price per square foot: $29/sqft
- Tax assessed value: $105,700
- Annual tax amount: $1,766
- Date on market: 2/9/2026
- Total actual rent: 0
- Road surface type: Paved
Foreclosure details
Estimated market value
Not available
Estimated sales range
Not available
$2,887/mo
Price history
| Date | Event | Price |
|---|---|---|
| 2/9/2026 | Listed for sale | $119,900+34.7%$46/sqft |
Source: MLS PIN #73475394 Report a problem | ||
| 1/22/2026 | Sold | $89,000-19.1%$34/sqft |
Source: Public Record Report a problem | ||
| 6/27/2024 | Sold | $110,000-11.9%$42/sqft |
Source: | ||
| 5/9/2024 | Contingent | $124,900$48/sqft |
Source: | ||
| 4/19/2024 | Listed for sale | $124,900+72.3%$48/sqft |
Source: | ||
| 10/5/2022 | Sold | $72,500-19.4%$28/sqft |
Source: | ||
| 7/15/2022 | Pending sale | $90,000$34/sqft |
Source: | ||
| 6/2/2022 | Listed for sale | $90,000$34/sqft |
Source: | ||
| 6/1/2022 | Listing removed | -- |
Source: | ||
| 5/30/2022 | Price change | $90,000-24.9%$34/sqft |
Source: | ||
| 5/23/2022 | Listed for sale | $119,900$46/sqft |
Source: | ||
| 12/11/2021 | Pending sale | $119,900$46/sqft |
Source: | ||
| 12/5/2021 | Listed for sale | $119,900+55.7%$46/sqft |
Source: | ||
| 1/23/2004 | Sold | $77,000$29/sqft |
Source: | ||
Public tax history
| Year | Property taxes | Tax assessment |
|---|---|---|
| 2025 | $1,766 -26.7% | $105,700 -24.8% |
| 2024 | $2,408 +9.6% | $140,500 +12.9% |
| 2023 | $2,198 +1.7% | $124,400 +6.6% |
| 2022 | $2,162 +7.6% | $116,700 +8.1% |
| 2021 | $2,010 +3.3% | $108,000 +3.3% |
| 2020 | $1,946 -0.5% | $104,500 +2.2% |
| 2019 | $1,955 +1% | $102,300 -2.8% |
| 2018 | $1,935 +5% | $105,300 +1% |
| 2017 | $1,843 +1.6% | $104,300 |
| 2016 | $1,814 +3.2% | $104,300 -0.9% |
| 2015 | $1,757 +4.8% | $105,300 |
| 2014 | $1,676 +4.1% | $105,300 +0.1% |
| 2013 | $1,610 +1.5% | $105,200 -1.7% |
| 2012 | $1,586 +5.9% | $107,000 |
| 2011 | $1,498 +8.9% | $107,000 -3.2% |
| 2010 | $1,375 +7.6% | $110,500 +1.3% |
| 2009 | $1,278 +3.5% | $109,100 |
| 2008 | $1,235 +25% | $109,100 +22.9% |
| 2007 | $988 -6.2% | $88,800 -2.4% |
| 2006 | $1,053 +12.4% | $91,000 +18.6% |
| 2005 | $937 +1.6% | $76,700 +10.5% |
| 2004 | $922 +32.7% | $69,400 +46.7% |
| 2003 | $695 +2.5% | $47,300 |
| 2002 | $678 -4.9% | $47,300 +3.7% |
| 2000 | $713 | $45,600 |
Find assessor info on the county website
Monthly payment
Estimated monthly payment$1,822
All calculations are estimates and provided by Zillow, Inc. for informational purposes only. Actual amounts may vary.
HOA fees may include property taxes on listings classified as Co-Ops. Contact the listing agent and/or owner for fee details.
Mortgage interest rates are dependent on a number of factors, including credit score, down payment, and repayment length. Interest rate data provided by Zillow Group Marketplace, Inc. as of 1/1/1970 from various mortgage lenders with which we have lead or other similar arrangements; the Estimated Payment is an average of those rates.
See how much you could borrow to make a competitive offer.
Climate risks
Neighborhood: 01247
Nearby schools
GreatSchools rating
- 5/10Colegrove Park ElementaryGrades: 3-6Distance: 0.4 mi
- 2/10Drury High SchoolGrades: 7-12Distance: 2.5 mi
A local agent can set up tours, give advice and negotiate with sellers.


- Massachusetts
- Berkshire County
- North Adams
- 01247
- 56 Liberty St
Nearby cities
Nearby zip codes
Other North Adams Topics
