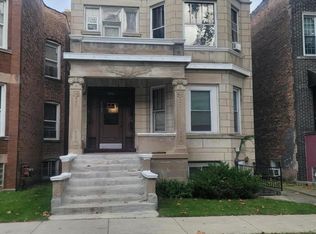
$307,300
6 bd2 ba2.4k sqft
6223 S Saint Lawrence Ave, Chicago, IL 60637
Off Market
Listing description withheld by the listing agent.
Zillow last checked:
Listing updated:
Nicole Harper 312-882-1705,
Smith Partners & Associates

Not available
Estimated sales range
Not available
Not available
| Date | Event | Price |
|---|---|---|
| 3/16/2026 | Sold | $215,000+43.3% |
Source: Public Record Report a problem | ||
| 5/31/2024 | Listing removed | -- |
Source:  MRED as distributed by MLS GRID #11919518 Report a problem | ||
| 5/16/2024 | Contingent | $150,000 |
Source: MRED as distributed by MLS GRID #11919518 Report a problem | ||
| 5/11/2024 | Price change | $150,000-69.7% |
Source: MRED as distributed by MLS GRID #11919518 Report a problem | ||
| 4/24/2024 | Price change | $495,000-3.9% |
Source: MRED as distributed by MLS GRID #11919518 Report a problem | ||
| 4/10/2024 | Listed for sale | $515,000 |
Source: MRED as distributed by MLS GRID #11919518 Report a problem | ||
| 12/28/2023 | Contingent | $515,000 |
Source: MRED as distributed by MLS GRID #11919518 Report a problem | ||
| 12/22/2023 | Price change | $515,000+63.5% |
Source: MRED as distributed by MLS GRID #11919518 Report a problem | ||
| 12/4/2023 | Price change | $315,000-20.1% |
Source: MRED as distributed by MLS GRID #11919518 Report a problem | ||
| 11/27/2023 | Price change | $394,000-21.2% |
Source: MRED as distributed by MLS GRID #11919518 Report a problem | ||
| 10/30/2023 | Listed for sale | $499,900 |
Source: MRED as distributed by MLS GRID #11919518 Report a problem | ||
| 10/26/2023 | Listing removed | -- |
Source: MRED as distributed by MLS GRID #11762127 Report a problem | ||
| 10/21/2023 | Listed for sale | $499,900 |
Source: MRED as distributed by MLS GRID #11762127 Report a problem | ||
| 6/27/2023 | Contingent | $499,900 |
Source: MRED as distributed by MLS GRID #11762127 Report a problem | ||
| 5/15/2023 | Price change | $499,900-9.1% |
Source: MRED as distributed by MLS GRID #11762127 Report a problem | ||
| 4/18/2023 | Listed for sale | $550,000+294.3% |
Source: MRED as distributed by MLS GRID #11762127 Report a problem | ||
| 11/19/2021 | Sold | $139,500+8.6% |
Source: MRED as distributed by MLS GRID #11103561 Report a problem | ||
| 9/17/2021 | Contingent | $128,500 |
Source: MRED as distributed by MLS GRID #11103561 Report a problem | ||
| 8/23/2021 | Listed for sale | $128,500 |
Source: MRED as distributed by MLS GRID #11103561 Report a problem | ||
| 7/15/2021 | Contingent | $128,500 |
Source: MRED as distributed by MLS GRID #11103561 Report a problem | ||
| 6/30/2021 | Listed for sale | $128,500 |
Source: MRED as distributed by MLS GRID #11103561 Report a problem | ||
| 6/25/2021 | Contingent | $128,500 |
Source: MRED as distributed by MLS GRID #11103561 Report a problem | ||
| 6/18/2021 | Price change | $128,500+7.2% |
Source: MRED as distributed by MLS GRID #11103561 Report a problem | ||
| 6/16/2021 | Listed for sale | $119,900 |
Source: MRED as distributed by MLS GRID #11103561 Report a problem | ||
| 6/11/2021 | Contingent | $119,900 |
Source: MRED as distributed by MLS GRID #11103561 Report a problem | ||
| 6/7/2021 | Listed for sale | $119,900 |
Source: MRED as distributed by MLS GRID #11103561 Report a problem | ||
| 6/3/2021 | Contingent | $119,900+67.7% |
Source: MRED as distributed by MLS GRID #11103561 Report a problem | ||
| 9/19/2008 | Sold | $71,500-74.5% |
Source: Public Record Report a problem | ||
| 10/14/2004 | Sold | $280,000 |
Source: Public Record Report a problem | ||
| Year | Property taxes | Tax assessment |
|---|---|---|
| 2024 | $5,039 +40% | $25,001 +47.1% |
| 2023 | $3,599 +2.9% | $16,999 |
| 2022 | $3,496 +2.3% | $16,999 |
| 2021 | $3,418 +5.6% | $16,999 +17% |
| 2020 | $3,237 -2.4% | $14,529 -12% |
| 2019 | $3,317 +1.7% | $16,511 |
| 2018 | $3,261 -19.2% | $16,511 -11.9% |
| 2017 | $4,036 +7.5% | $18,749 |
| 2016 | $3,755 +9.3% | $18,749 |
| 2015 | $3,436 +13.1% | $18,749 +14.5% |
| 2014 | $3,039 +2% | $16,380 |
| 2013 | $2,979 +1.4% | $16,380 |
| 2012 | $2,939 -11.9% | $16,380 -20.4% |
| 2011 | $3,337 -0.4% | $20,590 |
| 2010 | $3,350 +4.4% | $20,590 |
| 2009 | $3,211 -5.9% | $20,590 -13.4% |
| 2008 | $3,411 +1% | $23,777 |
| 2007 | $3,377 -1.1% | $23,777 |
| 2006 | $3,413 +42.9% | $23,777 +62.6% |
| 2005 | $2,389 +1% | $14,619 |
| 2004 | $2,365 +2.2% | $14,619 |
| 2003 | $2,313 +33.5% | $14,619 +51.5% |
| 2002 | $1,733 +3.8% | $9,648 |
| 2001 | $1,671 +19.6% | $9,648 |
| 2000 | $1,397 -0.7% | $9,648 +32.6% |
| 1999 | $1,407 | $7,274 |
Source: MRED as distributed by MLS GRID. This data may not be complete. We recommend contacting the local school district to confirm school assignments for this home.

A local agent can set up tours, give advice and negotiate with sellers.
A local lender can help you make sure your offer is ready when you are.