UNIQUE INVESTMENT OPPORTUNITY for both SEASONED INVESTORS and SAVVY HOMEOWNERS looking to LIVE FOR FREE while the other unit pays the mortgage. EXCEPTIONAL OVERSIZED 2-UNIT BUILDING, a rare find in today's market! Recently RENOVATED. GENEROUS Living Spaces in both units. MODERN AMENITIES. Each unit features 5 Bedrooms + 2 Full Baths + Beautiful Kitchen area. This property promises STRONG CASH FLOW! DON'T MISS OUT the opportunity!!! Schedule a showing TODAY and secure your future in Real Estate!
Active
$499,900
631 N Monticello Ave, Chicago, IL 60624
10beds
--sqft
Multi Family
Built in 1890
-- sqft lot
$-- Zestimate®
$--/sqft
$-- HOA
What's special
Modern amenitiesBeautiful kitchen areaGenerous living spaces
- 27 days
- 664
- 98
Zillow last checked:
Listing updated:
Listed by:
Jaroslaw Jastrzebski, ABR (312)487-3366,
eXp Realty
Source: MRED as distributed by MLS GRID,MLS#: 12772530
Facts & features
Interior
Bedrooms & bathrooms
- Bedrooms: 10
- Bathrooms: 4
- Full bathrooms: 4
Heating
- Forced Air
Features
- Basement: Partially Finished,Full
Video & virtual tour
Property
Lot
- Size: 3,049 Square Feet
- Dimensions: 26 X 125
Details
- Parcel number: 16111170100000
- Zoning: MULTI
- Special conditions: None
Construction
Type & style
- Home type: MultiFamily
- Architectural style: Greystone
- Property subtype: Multi Family
Materials
- Brick
- Foundation: Concrete Perimeter
- Roof: Rubber
Condition
- New construction: No
- Year built: 1890
- Major remodel year: 2023
Utilities & green energy
- Sewer: Public Sewer
- Water: Lake Michigan, Public
Community & HOA
Location
- Region: Chicago
Financial & listing details
- Tax assessed value: $280,000
- Annual tax amount: $5,831
- Date on market: 10/21/2026
- Ownership: Fee Simple
Estimated market value
Not available
Estimated sales range
Not available
Not available
Price history
| Date | Event | Price |
|---|---|---|
| 10/21/2026 | Listed for sale | $499,900+33.3% |
Source:  MRED as distributed by MLS GRID #12772530 Report a problem | ||
| 12/6/2023 | Listing removed | -- |
Source: MRED as distributed by MLS GRID #11920459 Report a problem | ||
| 11/23/2023 | Contingent | $375,000 |
Source: MRED as distributed by MLS GRID #11920459 Report a problem | ||
| 11/16/2023 | Listed for sale | $375,000 |
Source: MRED as distributed by MLS GRID #11920459 Report a problem | ||
| 11/7/2023 | Contingent | $375,000 |
Source: MRED as distributed by MLS GRID #11920459 Report a problem | ||
| 11/3/2023 | Listed for sale | $375,000+1026.1% |
Source: MRED as distributed by MLS GRID #11920459 Report a problem | ||
| 12/6/2017 | Listing removed | $1,550 |
Source: Go Section8 Report a problem | ||
| 9/29/2017 | Listed for rent | $1,550 |
Source: Go Section8 Report a problem | ||
| 10/31/2008 | Sold | $33,300-93% |
Source: MRED as distributed by MLS GRID #06818690 Report a problem | ||
| 10/17/2006 | Sold | $475,000+43.9% |
Source: Public Record Report a problem | ||
| 11/10/2003 | Sold | $330,000+222% |
Source: Public Record Report a problem | ||
| 8/25/2003 | Sold | $102,500 |
Source: Public Record Report a problem | ||
Public tax history
| Year | Property taxes | Tax assessment |
|---|---|---|
| 2024 | $5,642 +27% | $28,000 +33.3% |
| 2023 | $4,444 +2.9% | $20,999 |
| 2022 | $4,319 +2.3% | $20,999 |
| 2021 | $4,223 +50% | $20,999 +66.1% |
| 2020 | $2,816 -3.5% | $12,641 -13% |
| 2019 | $2,919 +1.7% | $14,530 |
| 2018 | $2,870 -11.7% | $14,530 -3.8% |
| 2017 | $3,250 +7.5% | $15,097 |
| 2016 | $3,024 +9.3% | $15,097 |
| 2015 | $2,766 -26.6% | $15,097 -25.7% |
| 2014 | $3,770 +2% | $20,317 |
| 2013 | $3,695 +1.4% | $20,317 |
| 2012 | $3,646 -11.2% | $20,317 -19.8% |
| 2011 | $4,106 -0.4% | $25,341 |
| 2010 | $4,124 +4.4% | $25,341 |
| 2009 | $3,952 -5.9% | $25,341 -13.4% |
| 2008 | $4,198 +1% | $29,267 |
| 2007 | $4,157 -1.1% | $29,267 |
| 2006 | $4,201 +62.5% | $29,267 +85% |
| 2005 | $2,586 +1% | $15,824 |
| 2004 | $2,560 +2.2% | $15,824 |
| 2003 | $2,504 +54.6% | $15,824 +75.5% |
| 2002 | $1,620 +3.8% | $9,016 |
| 2001 | $1,561 +10.9% | $9,016 |
| 2000 | $1,407 +0% | $9,016 +23.1% |
| 1999 | $1,407 | $7,326 |
Find assessor info on the county website
Monthly payment
Est. payment
Payment breakdown
Explore the cost of this home by adjusting the details. Changes won't be saved.Climate risks
Neighborhood: East Garfield Park
Nearby schools


Similar homes
- $545,0007 bd4 ba-- sqft710 N Central Park Ave, Chicago, IL 60624New
 MLS ID #12806742, Kimberly Townsend, Kale Realty. MRED as distributed by MLS GRID
- $499,0009 bd6 ba-- sqft3629 W Lexington St, Chicago, IL 60624Active
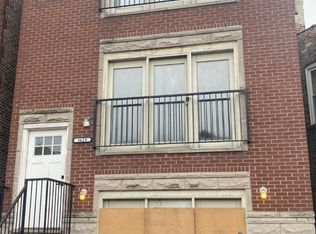 MLS ID #12592923, Dora Wooden, Illinois Star, LTD. MRED as distributed by MLS GRID
- $480,0009 bd2 ba-- sqft4246 W Adams St, Chicago, IL 60624Active
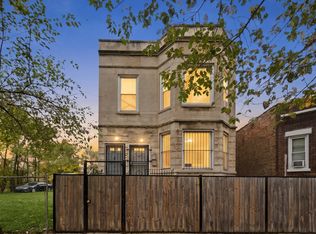 MLS ID #12799480, Vernita Miller, Kale Realty. MRED as distributed by MLS GRID
- $630,0009 bd6 ba-- sqft636 N Ridgeway Ave, Chicago, IL 60624Active
 MLS ID #12802842, Luis Perez, Realty of America, LLC. MRED as distributed by MLS GRID
