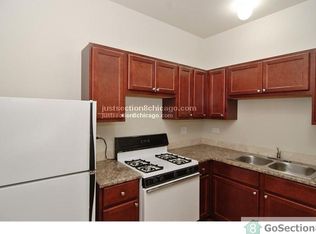
Great investment opportunity with an established tenants. This well maintained 2-unit building offers spacious living areas plus a bright basement. The first floor unit features 2 bedrooms and 1 bathroom, while the second floor unit offers 3 bedrooms and 1 bathroom. The basement includes an additional 2 bedrooms, 1 bathroom living space. The property also includes a 2-car garage and established tenants. New water main installed last year.***This property may qualify for a rate buydown through a participating lender. Subject to buyer qualification and lender terms. Contact listing agent for details.****
Active
$499,999
856 N Waller Ave, Chicago, IL 60651
7beds
--sqft
Multi Family
Built in 1900
-- sqft lot
$498,600 Zestimate®
$--/sqft
$-- HOA
What's special
Bright basement
- 41 days
- 302
- 27
Zillow last checked:
Listing updated:
Listed by:
Luis Ortiz 773-571-0411,
RE/MAX Partners
Source: MRED as distributed by MLS GRID,MLS#: 12757105
Facts & features
Interior
Bedrooms & bathrooms
- Bedrooms: 7
- Bathrooms: 3
- Full bathrooms: 3
Heating
- Natural Gas, Forced Air
Features
- Basement: Finished,Full,Walk-Out Access
Property
Parking
- Total spaces: 4
- Parking features: Yes, Garage Owned, Detached, Owned, Garage
- Garage spaces: 2
Lot
- Size: 3,224 Square Feet
- Dimensions: 124x26
Details
- Parcel number: 16054290360000
- Zoning: MULTI
- Special conditions: None
Construction
Type & style
- Home type: MultiFamily
- Property subtype: Multi Family
Materials
- Brick
Condition
- New construction: No
- Year built: 1900
Utilities & green energy
- Sewer: Public Sewer
- Water: Lake Michigan
Community & HOA
Location
- Region: Chicago
Financial & listing details
- Tax assessed value: $270,000
- Annual tax amount: $5,606
- Date on market: 9/11/2026
- Ownership: Fee Simple
Estimated market value
$498,600
$474,000 - $524,000
$1,764/mo
Price history
| Date | Event | Price |
|---|---|---|
| 9/11/2026 | Listed for sale | $499,999+58.7% |
Source: MRED as distributed by MLS GRID #12757105 Report a problem | ||
| 12/15/2022 | Sold | $315,000 |
Source:  MRED as distributed by MLS GRID #11610350 Report a problem | ||
| 11/17/2022 | Listed for sale | $315,000 |
Source: MRED as distributed by MLS GRID #11610350 Report a problem | ||
| 10/5/2022 | Pending sale | $315,000 |
Source: MRED as distributed by MLS GRID #11610350 Report a problem | ||
| 9/24/2022 | Price change | $315,000-4.3% |
Source: MRED as distributed by MLS GRID #11610350 Report a problem | ||
| 8/22/2022 | Listed for sale | $329,000 |
Source: MRED as distributed by MLS GRID #11610350 Report a problem | ||
| 8/22/2022 | Listing removed | -- |
Source: MRED as distributed by MLS GRID #11442011 Report a problem | ||
| 6/29/2022 | Price change | $329,000-6% |
Source: MRED as distributed by MLS GRID #11442011 Report a problem | ||
| 6/21/2022 | Listed for sale | $349,900+774.8% |
Source: MRED as distributed by MLS GRID #11442011 Report a problem | ||
| 7/12/2010 | Sold | $40,000-19.8% |
Source: MRED as distributed by MLS GRID #07319450 Report a problem | ||
| 4/3/2010 | Listed for sale | $49,900-41.9% |
Source: @properties #07319450 Report a problem | ||
| 4/26/2009 | Listed for sale | $85,900 |
Source: Owner Report a problem | ||
Public tax history
| Year | Property taxes | Tax assessment |
|---|---|---|
| 2024 | $5,425 +42.8% | $27,000 +50% |
| 2023 | $3,798 +55.9% | $17,999 |
| 2022 | $2,436 -32.7% | $17,999 |
| 2021 | $3,619 +8.8% | $17,999 +20.5% |
| 2020 | $3,327 -2.4% | $14,933 -12% |
| 2019 | $3,410 +1.7% | $16,970 |
| 2018 | $3,352 -22.3% | $16,970 -15.3% |
| 2017 | $4,315 +7.5% | $20,043 |
| 2016 | $4,014 +9.3% | $20,043 |
| 2015 | $3,673 +17.9% | $20,043 +19.4% |
| 2014 | $3,115 +2% | $16,791 |
| 2013 | $3,054 +1.4% | $16,791 |
| 2012 | $3,013 -3.5% | $16,791 -12.8% |
| 2011 | $3,122 -0.4% | $19,265 |
| 2010 | $3,135 +65.6% | $19,265 |
| 2009 | $1,894 -21.3% | $19,265 -22.4% |
| 2008 | $2,407 +276.4% | $24,839 |
| 2007 | $640 -82.1% | $24,839 |
| 2006 | $3,566 +33.5% | $24,839 +52% |
| 2005 | $2,671 +1% | $16,345 |
| 2004 | $2,644 +2.2% | $16,345 |
| 2003 | $2,586 +17.5% | $16,345 +33.4% |
| 2002 | $2,202 +97.6% | $12,256 |
| 2001 | $1,114 -42.6% | $12,256 |
| 2000 | $1,940 +26.7% | $12,256 +21.3% |
| 1999 | $1,531 | $10,101 |
Find assessor info on the county website
Monthly payment
Est. payment
Payment breakdown
Explore the cost of this home by adjusting the details. Changes won't be saved.Climate risks
Neighborhood: South Austin
Nearby schools

Similar homes
- $499,0007 bd4 ba-- sqft4229 W Division St, Chicago, IL 60651Active
 MLS ID #12780819, Tatiana Hernandez, Keller Williams Premiere Properties. MRED as distributed by MLS GRID
- $400,0006 bd2 ba-- sqft5513 W Cortez St, Chicago, IL 60651Active
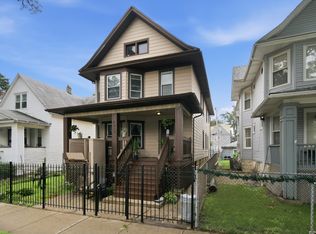 MLS ID #12756358, Luz Gutierrez Garcia, RE/MAX LOYALTY. MRED as distributed by MLS GRID
- $450,0006 bd3 ba-- sqft1235 N Harding Ave, Chicago, IL 60651Active
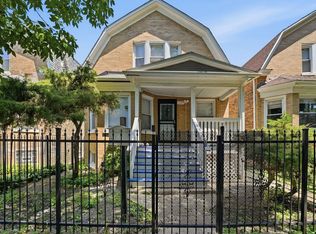 MLS ID #12776381, Joseluis Martinez, Epique Realty Inc. MRED as distributed by MLS GRID
- $489,9995 bd2 ba-- sqft3333 W Pierce Ave, Chicago, IL 60651Active
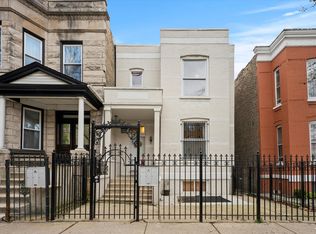 MLS ID #12780601, Matt Laricy, Americorp, Ltd. MRED as distributed by MLS GRID
