Beautifully renovated 3 bedroom, 2 bathroom house in downtown Savannah. This property is located 1 mile away from Forsyth Park in a historic area on a quiet block. Great location and easy access to Historic Downtown, the new Enmarket arena, SCAD, shops and restaurants.
For sale
$199,900
631 W 35 Street, Savannah, GA 31415
3beds
1,394sqft
Single Family Residence
Built in 1955
4,356 Square Feet Lot
$-- Zestimate®
$143/sqft
$-- HOA
What's special
Quiet block
- 25 days
- 972
- 113
Likely to sell faster than
Zillow last checked:
Listing updated:
Listed by:
Harold D. Jackson 912-604-6263,
TFI Realty LLC
Source: Hive MLS,MLS#: SA366589 Originating MLS: Savannah Multi-List Corporation
Facts & features
Interior
Bedrooms & bathrooms
- Bedrooms: 3
- Bathrooms: 2
- Full bathrooms: 2
Heating
- Central, Electric
Cooling
- Central Air, Electric
Appliances
- Included: Electric Water Heater
- Laundry: In Hall
Features
- Common walls with other units/homes: No One Above
Interior area
- Total interior livable area: 1,394 sqft
Property
Lot
- Size: 4,356 Square Feet
Details
- Parcel number: 20066 41023
- Lease amount: $2,038
- Land lease expiration date: 1738368000000
- Special conditions: Standard
Construction
Type & style
- Home type: SingleFamily
- Architectural style: A-Frame
- Property subtype: Single Family Residence
- Attached to another structure: Yes
Materials
- Brick
Condition
- Year built: 1955
Utilities & green energy
- Sewer: Public Sewer
- Water: Public
Community & HOA
Community
- Features: None
HOA
- Has HOA: No
Location
- Region: Savannah
Financial & listing details
- Price per square foot: $143/sqft
- Tax assessed value: $236,600
- Annual tax amount: $2,725
- Date on market: 10/16/2026
- Listing agreement: Exclusive Agency
- Listing terms: Cash,Conventional,1031 Exchange,FHA,VA Loan
- Ownership type: Investor
Estimated market value
Not available
Estimated sales range
Not available
$1,811/mo
Price history
| Date | Event | Price |
|---|---|---|
| 10/17/2026 | Listed for sale | $199,900-7%$143/sqft |
Source:  Hive MLS #SA366589 Report a problem | ||
| 6/5/2026 | Listing removed | $214,900$154/sqft |
Source: Hive MLS #SA343034 Report a problem | ||
| 4/10/2026 | Price change | $214,9000%$154/sqft |
Source: Hive MLS #SA343034 Report a problem | ||
| 3/10/2026 | Price change | $215,000-10.4%$154/sqft |
Source: Hive MLS #SA343034 Report a problem | ||
| 1/7/2026 | Price change | $239,900-4%$172/sqft |
Source: Hive MLS #SA343034 Report a problem | ||
| 12/10/2025 | Price change | $249,900-3.8%$179/sqft |
Source: Hive MLS #SA343034 Report a problem | ||
| 11/5/2025 | Listed for sale | $259,900-5.5%$186/sqft |
Source: Hive MLS #SA343034 Report a problem | ||
| 7/18/2024 | Listing removed | $274,900$197/sqft |
Source:  Hive MLS #311692 Report a problem | ||
| 5/9/2024 | Listed for sale | $274,900+223.4%$197/sqft |
Source: Hive MLS #311692 Report a problem | ||
| 1/25/2023 | Listing removed | -- |
Source: Zillow Rentals Report a problem | ||
| 1/23/2023 | Price change | $1,900-13.6%$1/sqft |
Source: Zillow Rentals Report a problem | ||
| 1/17/2023 | Listed for rent | $2,200$2/sqft |
Source: Zillow Rentals Report a problem | ||
| 9/18/2022 | Listing removed | -- |
Source: Zillow Rental Manager Report a problem | ||
| 9/13/2022 | Listed for rent | $2,200$2/sqft |
Source: Zillow Rental Manager Report a problem | ||
| 1/19/2022 | Sold | $85,000$61/sqft |
Source: Public Record Report a problem | ||
Public tax history
| Year | Property taxes | Tax assessment |
|---|---|---|
| 2025 | $2,725 +3% | $94,640 +4% |
| 2024 | $2,644 +166.3% | $91,000 +167.6% |
| 2023 | $993 +8.8% | $34,000 +8.8% |
| 2022 | $912 +7.6% | $31,240 +13.5% |
| 2021 | $848 +48.9% | $27,520 +52.5% |
| 2020 | $570 0% | $18,040 |
| 2019 | $570 -28.9% | $18,040 +10.3% |
| 2018 | $802 +8.9% | $16,360 +5.1% |
| 2017 | $736 +12.3% | $15,560 -1.5% |
| 2016 | $655 +5.2% | $15,800 -3.9% |
| 2015 | $623 -42.1% | $16,440 -14.2% |
| 2014 | $1,076 | $19,160 -4.6% |
| 2013 | -- | $20,080 -1% |
| 2012 | -- | $20,280 -10.3% |
| 2011 | -- | $22,600 -14.4% |
| 2010 | -- | $26,400 |
| 2009 | -- | $26,400 -34.3% |
| 2008 | -- | $40,200 +24.1% |
| 2007 | -- | $32,400 +31.7% |
| 2006 | -- | $24,600 -3.9% |
| 2005 | -- | $25,600 +17.4% |
| 2003 | -- | $21,800 +4.8% |
| 2002 | -- | $20,800 +9.5% |
| 2001 | -- | $19,000 |
Find assessor info on the county website
Monthly payment
Est. payment
Payment breakdown
Explore the cost of this home by adjusting the details. Changes won't be saved.Climate risks
Neighborhood: Cuyler/Brownville

Similar homes
- $215,0003 bd2 ba1.1k sqft618 Magazine Avenue, Savannah, GA 31415For Sale
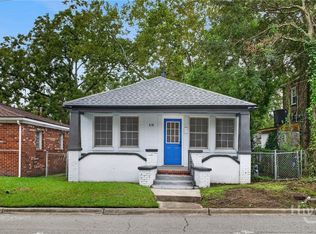
 MLS ID #SA366127, Chelsey Oherron, Realty One Group Inclusion. Hive MLS
- $230,0003 bd2 ba916 sqft704 Lavinia Street, Savannah, GA 31415For Sale
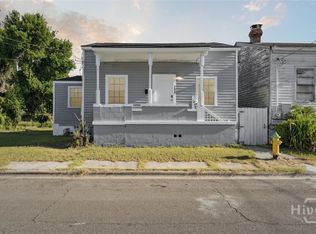 MLS ID #SA340619, Alexander T. Rodino, Keller Williams Coastal Area P. Hive MLS
- $259,9002 bd3 ba1k sqft636 W 35th Street, Savannah, GA 31415For Sale
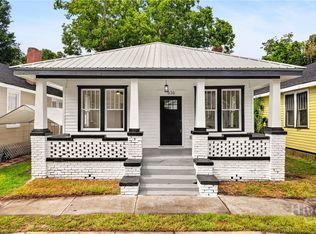 MLS ID #SA367758, Brent Sappe, Corcoran Austin Hill Realty. Hive MLS
- $179,9003 bd1 ba864 sqft2107 Augusta Avenue, Savannah, GA 31415For Sale
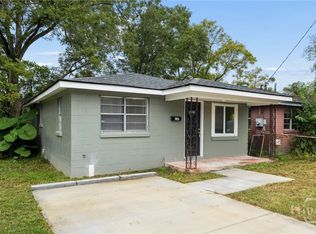 MLS ID #SA365883, Andrew C. Myers, Seaport Real Estate Group. Hive MLS
- $245,0003 bd2 ba1.4k sqft232 Sugden Street, Savannah, GA 31415For SaleMLS ID #SA362136, Berthenia M. Brown, Keller Williams Coastal Area P. Hive MLS
- $229,0003 bd1 ba1.5k sqft113 Linden Drive, Savannah, GA 31405For SaleMLS ID #SA367512, Sarah Sullivan, McIntosh Realty Team LLC. Hive MLS
- $210,0002 bd1 ba900 sqft2032 Eppinger Street, Savannah, GA 31415For SaleMLS ID #SA362159, Terri Stewart, Buy Sell Savannah Real Estate. Hive MLS
- $259,0003 bd2 ba1.1k sqft1809 Delesseps Avenue, Savannah, GA 31404For SaleMLS ID #SA367733, Ivan Shalavuta, Realty One Group Inclusion. Hive MLS
- $165,0003 bd1 ba962 sqft120 Ferrill Street, Savannah, GA 31415For SaleMLS ID #SA360516, James Louis Grekousis, LPT Realty LLC. Hive MLS
- $219,9002 bd1 ba1k sqft2214 E 37Th Street, Savannah, GA 31404For SaleMLS ID #SA365555, Jessica L. Kelly, Engel & Volkers. Hive MLS
- $264,9003 bd2 ba1.4k sqft2218 Hanson Street, Savannah, GA 31404For SaleMLS ID #SA367881, Christina L. McIntosh, McIntosh Realty Team LLC. Hive MLS
- $210,0003 bd1 ba1k sqft1920 Clemson Street, Savannah, GA 31404For SaleMLS ID #SA350454, Shelley S Smith, BHHS Bay Street Realty Group. Hive MLS
- $249,0003 bd1 ba1.1k sqft325 Bunting Drive, Savannah, GA 31404For SaleMLS ID #SA367691, Jessica M. Ramirez Lopez, eXp Realty LLC. Hive MLS
- $225,0003 bd1 ba1.3k sqft2031 Utah Street, Savannah, GA 31404For SaleMLS ID #SA362523, Nicole A. Moore, Real Broker, LLC. Hive MLS
- $219,0003 bd1 ba1.1k sqft5 Lansing Avenue, Savannah, GA 31406For SaleMLS ID #SA366700, Amber Williams, Re/Max Savannah. Hive MLS
- $220,0003 bd1 ba960 sqft1513 Vine Street, Savannah, GA 31401For SaleMLS ID #SA346530, Ivelise O'Neal, LPT Realty LLC. Hive MLS
- $179,0003 bd2 ba1.1k sqft4316 Raybun Street, Savannah, GA 31405For SaleMLS ID #SA348976, Ed Yannett, Epique Realty. Hive MLS
- $239,0003 bd2 ba1.2k sqft2123 Utah Street, Savannah, GA 31404For SaleMLS ID #SA361185, Sheri L. Brown Hall, Keller Williams Coastal Area P. Hive MLS
- $215,0003 bd2 ba1.3k sqft126 S Robinhood Drive, Savannah, GA 31406For SaleMLS ID #SA358917, Tracy D. Boles, Keller Williams Coastal Area P. Hive MLS
- $179,9003 bd1 ba912 sqft223 Godsells Street, Savannah, GA 31405For SaleMLS ID #SA349714, Wynn Martin, Eighteen O'Two Realty LLC. Hive MLS
