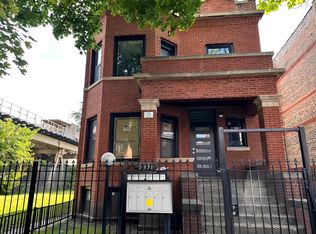
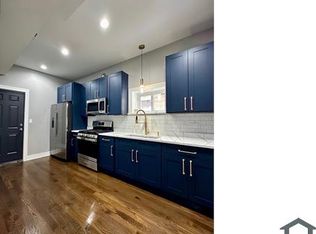
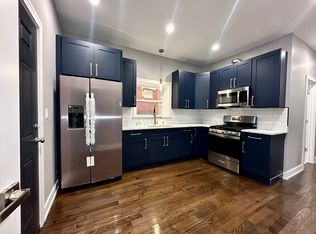
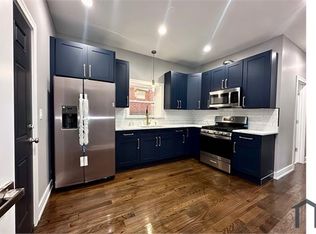
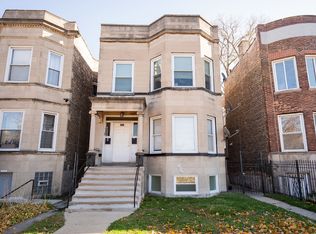
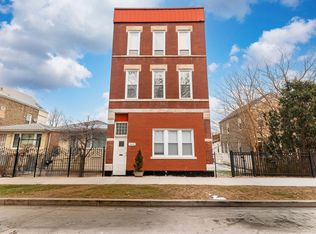
The best deal in town. This Four Unit Brick building will not disappoint. Fully Updated Electrical, plumbing, hvac. This place is the investors dream. Fully fenced 4-unit building with strong cash flow and major recent improvements. Three units were remodeled in 2024 and are currently rented for $1,700, $1,700, and $1,800 per month, providing immediate income. The fourth unit was fully renovated in 2026 with higher-end finishes and is ready for a new tenant. Major updates include new electrical, plumbing, HVAC, and roof (2024), plus a new on-site laundry room (2025) Income Potential: Current Rental Income: $5,200/month ($62,400/year) When fully Rented at $1,800 for Unit 4: $7,000/month ($84,000/year)
Contingent
$699,990
6331 S Elizabeth St, Chicago, IL 60636
10beds
--sqft
Multi Family
Built in 1910
-- sqft lot
$702,900 Zestimate®
$--/sqft
$-- HOA
What's special
Four unit brick buildingFully updated electrical
- 22 days |
- 261 |
- 15 |
Zillow last checked:
Listing updated:
Listed by:
Verenice Escareno 708-323-8499,
Realty of America, LLC
Source: MRED as distributed by MLS GRID,MLS#: 12673478
Facts & features
Interior
Bedrooms & bathrooms
- Bedrooms: 10
- Bathrooms: 4
- Full bathrooms: 4
Heating
- Steam
Appliances
- Included: Gas Water Heater
Features
- Basement: Finished,Full
Property
Lot
- Size: 3,750 Square Feet
- Dimensions: 30 X 125
Details
- Parcel number: 20201070090000
- Zoning: MULTI
- Special conditions: None
- Other equipment: Ceiling Fan(s)
Construction
Type & style
- Home type: MultiFamily
- Property subtype: Multi Family
Materials
- Brick
Condition
- New construction: No
- Year built: 1910
- Major remodel year: 2026
Utilities & green energy
- Sewer: Public Sewer
- Water: Public
Community & HOA
Community
- Security: Carbon Monoxide Detector(s)
Location
- Region: Chicago
Financial & listing details
- Tax assessed value: $190,000
- Annual tax amount: $1,899
- Date on market: 6/10/2026
- Ownership: Fee Simple
Estimated market value
$702,900
$668,000 - $738,000
$1,557/mo
Price history
| Date | Event | Price |
|---|---|---|
| 6/16/2026 | Contingent | $699,990 |
Source: | ||
| 6/10/2026 | Listed for sale | $699,990 |
Source: | ||
| 5/12/2026 | Listing removed | $699,990 |
Source: | ||
| 4/12/2026 | Listed for sale | $699,990-6.7% |
Source: | ||
| 4/12/2026 | Listing removed | $750,000 |
Source: | ||
| 2/17/2026 | Listed for sale | $750,000+53.1% |
Source: | ||
| 8/21/2024 | Sold | $490,000+730.5% |
Source: Public Record Report a problem | ||
| 2/7/2020 | Sold | $59,000-17.5% |
Source: Public Record Report a problem | ||
| 10/3/2019 | Listed for sale | -- |
Source: Auction.com Report a problem | ||
| 6/19/1997 | Sold | $71,500 |
Source: Public Record Report a problem | ||
Public tax history
| Year | Property taxes | Tax assessment |
|---|---|---|
| 2024 | -- | $19,000 +111.1% |
| 2023 | $1,899 +2.6% | $9,000 |
| 2022 | $1,851 +2.3% | $9,000 |
| 2021 | $1,810 +15.5% | $9,000 +28% |
| 2020 | $1,567 -2.4% | $7,033 -12% |
| 2019 | $1,606 +1.7% | $7,993 |
| 2018 | $1,579 -63% | $7,993 -59.7% |
| 2017 | $4,268 +7.5% | $19,828 |
| 2016 | $3,971 +94.7% | $19,828 +78.1% |
| 2015 | $2,040 -28.2% | $11,132 -27.3% |
| 2014 | $2,842 +23.2% | $15,316 |
| 2013 | $2,307 +162.7% | $15,316 +177.7% |
| 2012 | $878 -56.8% | $5,516 -56.1% |
| 2011 | $2,035 +114.4% | $12,557 +115.3% |
| 2010 | $949 +4.4% | $5,833 |
| 2009 | $910 -65.4% | $5,833 -68.1% |
| 2008 | $2,625 +1% | $18,300 |
| 2007 | $2,599 -11.7% | $18,300 -10.7% |
| 2006 | $2,944 +70.7% | $20,504 +94.3% |
| 2005 | $1,725 +1% | $10,554 |
| 2004 | $1,707 +2.2% | $10,554 |
| 2003 | $1,670 +15.3% | $10,554 +31% |
| 2002 | $1,448 +3.8% | $8,059 |
| 2001 | $1,396 +27% | $8,059 |
| 2000 | $1,099 +0% | $8,059 +40.9% |
| 1999 | $1,099 | $5,719 |
Find assessor info on the county website
Monthly payment
Est. payment$--/mo
Payment breakdown
Explore the cost of this home by adjusting the details. Changes won't be saved.All calculations are estimates and provided by Zillow, Inc. for informational purposes only. Actual amounts may vary.
HOA fees may include property taxes on listings classified as Co-Ops. Contact the listing agent and/or owner for fee details.
Mortgage interest rates are dependent on a number of factors, including credit score, down payment, and repayment length. Interest rate data provided by Zillow Group Marketplace, Inc. as of 1/1/1970 from various mortgage lenders with which we have lead or other similar arrangements; the Estimated Payment is an average of those rates.
See how much you could borrow to make a competitive offer.
Climate risks
Neighborhood: Englewood
Nearby schools
GreatSchools rating
- 4/10Bass Elementary SchoolGrades: PK-8Distance: 0.3 mi
- 7/10Lindblom Math & Science Academy High SchoolGrades: 7-12Distance: 0.9 mi
Schools provided by the listing agent
- District: 299
Source: MRED as distributed by MLS GRID. This data may not be complete. We recommend contacting the local school district to confirm school assignments for this home.
A local agent can set up tours, give advice and negotiate with sellers.


- Illinois
- Cook County
- Chicago
- 60636
- Englewood
- 6331 S Elizabeth St
Nearby cities
Nearby neighborhoods
Nearby zip codes
Other Chicago Topics
