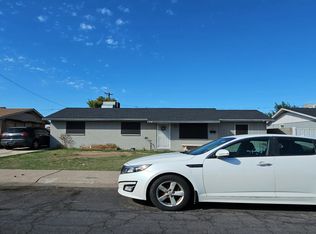
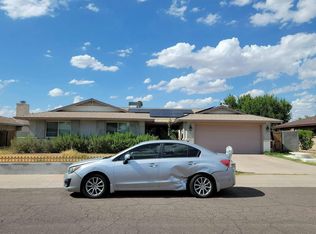
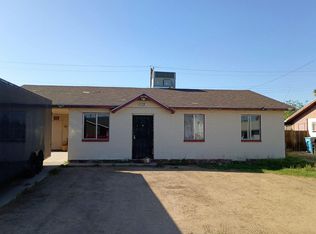
$341,400
-- bd2 ba1.5k sqft
6517 W Colter St, Glendale, AZ 85301
Off Market
Likely to sell faster than
Zillow last checked:
Listing updated:
Zoe Whitney 480-234-4102,
eXp Realty

Not available
Estimated sales range
Not available
Not available
| Date | Event | Price |
|---|---|---|
| 10/15/2026 | Listed for sale | $499,928+32.4%$255/sqft |
Source:  ARMLS #7094167 Report a problem | ||
| 6/28/2024 | Sold | $377,448+11%$192/sqft |
Source: Public Record Report a problem | ||
| 8/25/2021 | Sold | $340,000+4.6%$173/sqft |
Source: ARMLS #6235840 Report a problem | ||
| 8/4/2021 | Pending sale | $325,000$165/sqft |
Source: ARMLS #6235840 Report a problem | ||
| 8/4/2021 | Listed for sale | $325,000$165/sqft |
Source: ARMLS #6235840 Report a problem | ||
| 7/13/2021 | Pending sale | $325,000$165/sqft |
Source: ARMLS #6235840 Report a problem | ||
| 7/9/2021 | Listed for sale | $325,000$165/sqft |
Source: ARMLS #6235840 Report a problem | ||
| 6/11/2021 | Pending sale | $325,000$165/sqft |
Source: ARMLS #6235840 Report a problem | ||
| 6/7/2021 | Listed for sale | $325,000$165/sqft |
Source: ARMLS #6235840 Report a problem | ||
| 6/7/2021 | Pending sale | $325,000$165/sqft |
Source: ARMLS #6235840 Report a problem | ||
| 6/3/2021 | Listed for sale | $325,000$165/sqft |
Source: ARMLS #6235840 Report a problem | ||
| 5/18/2021 | Pending sale | $325,000$165/sqft |
Source: ARMLS #6235840 Report a problem | ||
| 5/17/2021 | Listing removed | $325,000$165/sqft |
Source: ARMLS #6235840 Report a problem | ||
| 5/14/2021 | Listed for sale | $325,000+273.6%$165/sqft |
Source: ARMLS #6235840 Report a problem | ||
| 9/29/2012 | Sold | $87,000+45%$44/sqft |
Source: ARMLS #4813977 Report a problem | ||
| 4/28/2010 | Sold | $60,001-73.3%$31/sqft |
Source: Public Record Report a problem | ||
| 5/1/2008 | Sold | $225,000+60.1%$115/sqft |
Source: Public Record Report a problem | ||
| 8/20/2007 | Sold | $140,500$72/sqft |
Source: Public Record Report a problem | ||
| Year | Property taxes | Tax assessment |
|---|---|---|
| 2025 | $860 +4.1% | $29,660 -7.2% |
| 2024 | $827 +10.3% | $31,950 +396.7% |
| 2023 | $749 -1% | $6,433 -66.8% |
| 2022 | $757 -0.8% | $19,350 +8.6% |
| 2021 | $763 +1% | $17,810 +15.8% |
| 2020 | $755 +4.3% | $15,380 +9.3% |
| 2019 | $724 | $14,070 +8.4% |
| 2018 | $724 -1.4% | $12,980 +29.7% |
| 2017 | $734 +11.8% | $10,010 +5.7% |
| 2016 | $657 -1.2% | $9,470 +26.9% |
| 2015 | $665 | $7,460 +63.6% |
| 2014 | -- | $4,560 +21% |
| 2013 | -- | $3,770 -2.6% |
| 2012 | -- | $3,870 -8.1% |
| 2011 | -- | $4,210 -36.2% |
| 2010 | -- | $6,600 -58.5% |
| 2009 | -- | $15,900 -12.4% |
| 2008 | -- | $18,150 +25.6% |
| 2007 | -- | $14,450 +41.7% |
| 2006 | -- | $10,200 |
| 2005 | -- | $10,200 +11.5% |
| 2004 | -- | $9,150 |
| 2003 | -- | $9,150 +26.2% |
| 2002 | -- | $7,250 |
Source: ARMLS. This data may not be complete. We recommend contacting the local school district to confirm school assignments for this home.


A local agent can set up tours, give advice and negotiate with sellers.