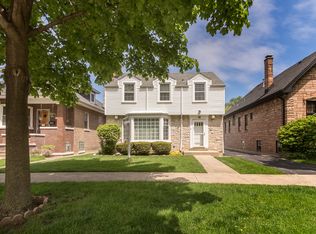
GREAT BRICK BUNGALOW IN VERY GOOD CONDITION, HARDWOOD FLOORS, CHARMING KITCHEN WITH TABLE SPACE, ONE AND HALF BATHROOMS, CENTRAL AIR, NEW ROOF, NEW WINDOWS, FINISHED BASEMENT, FINISHED ATTIC. 2 1/2 CAR GARAGE WITH EDO, LOCATED ON LOVELY TREE LINED STREET. CLOSE TO SCHOOLS, SHOPPING AND TRANSPORTATION.
Foreclosed
Est. $340,200
6519 33rd St, Berwyn, IL 60402
3beds
1,300sqft
SingleFamily
Built in 1925
3,720 Square Feet Lot
$340,200 Zestimate®
$262/sqft
$-- HOA
Overview
- 141 days |
- 11 |
- 0 |
Facts & features
Interior
Bedrooms & bathrooms
- Bedrooms: 3
- Bathrooms: 2
- Full bathrooms: 1
- 1/2 bathrooms: 1
Heating
- Forced air, Gas
Cooling
- Central
Appliances
- Included: Dryer, Microwave, Range / Oven, Refrigerator, Washer
Features
- Flooring: Tile, Hardwood, Linoleum / Vinyl
Interior area
- Total interior livable area: 1,300 sqft
Property
Parking
- Parking features: Garage - Detached
Features
- Exterior features: Brick
Lot
- Size: 3,720 Square Feet
Details
- Parcel number: 1631219029
Construction
Type & style
- Home type: SingleFamily
Materials
- Roof: Asphalt
Condition
- Year built: 1925
Community & HOA
Location
- Region: Berwyn
Financial & listing details
- Price per square foot: $262/sqft
- Tax assessed value: $254,800
Visit our professional directory to find a foreclosure specialist in your area that can help with your home search.
Find a foreclosure agentForeclosure details
Estimated market value
$340,200
$323,000 - $357,000
$2,641/mo
Price history
| Date | Event | Price |
|---|---|---|
| 5/10/2022 | Sold | $280,000$215/sqft |
Source: | ||
| 3/17/2022 | Contingent | $280,000$215/sqft |
Source: | ||
| 3/15/2022 | Listed for sale | $280,000$215/sqft |
Source: | ||
| 2/23/2022 | Contingent | $280,000$215/sqft |
Source: | ||
| 2/17/2022 | Listed for sale | $280,000+35.9%$215/sqft |
Source: | ||
| 12/22/2015 | Sold | $206,000-4.1%$158/sqft |
Source: | ||
| 10/15/2015 | Price change | $214,900-1.9%$165/sqft |
Source: RE/MAX Partners #09064045 Report a problem | ||
| 9/2/2015 | Price change | $219,000-4.4%$168/sqft |
Source: CENTURY 21 Affiliated #09014992 Report a problem | ||
| 7/22/2015 | Price change | $229,000-4.5%$176/sqft |
Source: CENTURY 21 Affiliated #09014992 Report a problem | ||
| 6/30/2015 | Price change | $239,900-4%$185/sqft |
Source: CENTURY 21 Affiliated #08904693 Report a problem | ||
| 6/2/2015 | Price change | $249,900-3.8%$192/sqft |
Source: CENTURY 21 Affiliated #08904693 Report a problem | ||
| 4/28/2015 | Listed for sale | $259,900$200/sqft |
Source: Century 21 Affiliated #08904693 Report a problem | ||
Public tax history
| Year | Property taxes | Tax assessment |
|---|---|---|
| 2024 | -- | $25,480 |
| 2023 | $9,109 +49% | $25,480 +51% |
| 2022 | $6,115 +2.4% | $16,877 |
| 2021 | $5,972 +4.1% | $16,877 |
| 2020 | $5,739 +18.5% | $16,877 +19% |
| 2019 | $4,845 +1.5% | $14,179 -3.5% |
| 2018 | $4,774 -32.4% | $14,689 -25.2% |
| 2017 | $7,064 +47.7% | $19,645 +45.2% |
| 2016 | $4,783 +3.2% | $13,527 |
| 2015 | $4,635 +3.2% | $13,527 |
| 2014 | $4,493 -5.3% | $13,527 -13.5% |
| 2013 | $4,746 +4.3% | $15,647 |
| 2012 | $4,552 +2.8% | $15,647 |
| 2011 | $4,427 +3.2% | $15,647 -16.3% |
| 2010 | $4,289 +8.4% | $18,694 |
| 2009 | $3,956 +12.7% | $18,694 -15% |
| 2008 | $3,512 -0.2% | $21,992 +5% |
| 2007 | $3,518 +7.7% | $20,937 |
| 2006 | $3,265 +3.9% | $20,937 |
| 2005 | $3,142 -6.8% | $20,937 +41.1% |
| 2004 | $3,373 +2.4% | $14,842 |
| 2003 | $3,294 +3.1% | $14,842 |
| 2002 | $3,195 +18.9% | $14,842 +23.8% |
| 2001 | $2,688 -0.8% | $11,991 |
| 2000 | $2,709 +10.3% | $11,991 |
| 1999 | $2,455 | $11,991 |
Find assessor info on the county website
Monthly payment
Estimated monthly payment$1,822
All calculations are estimates and provided by Zillow, Inc. for informational purposes only. Actual amounts may vary.
HOA fees may include property taxes on listings classified as Co-Ops. Contact the listing agent and/or owner for fee details.
Mortgage interest rates are dependent on a number of factors, including credit score, down payment, and repayment length. Interest rate data provided by Zillow Group Marketplace, Inc. as of 1/1/1970 from various mortgage lenders with which we have lead or other similar arrangements; the Estimated Payment is an average of those rates.
See how much you could borrow to make a competitive offer.
Climate risks
Neighborhood: 60402
Nearby schools
GreatSchools rating
- 6/10Emerson Elementary SchoolGrades: K-5Distance: 0.5 mi
- 8/10Heritage Middle SchoolGrades: 6-8Distance: 0.5 mi
- 6/10J Sterling Morton West High SchoolGrades: 9-12Distance: 1.2 mi


- Illinois
- Cook County
- Berwyn
- 60402
- 6519 33rd St
Nearby cities
Nearby zip codes
Other Berwyn Topics
