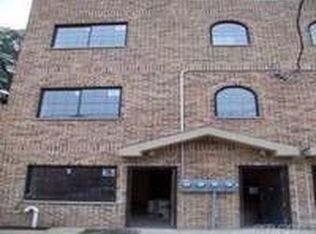
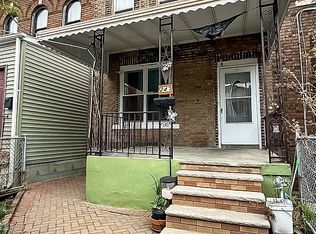
655 Maple Street – Single Family Home
Discover a prime real estate opportunity at 655 Maple Street, ideally located between Troy and Schenectady Avenues. This single-family residence offers significant development potential in a highly sought-after location.
Situated on a 19' x 30' x 110' lot with additional buildable square footage, this property presents an excellent opportunity for expansion, full renovation, or custom development.
To ensure all prospective buyers fully understand the scope of work involved, all showings must be accompanied by either a licensed contractor or architect. This is strongly encouraged so buyers can properly evaluate the renovation needs, potential costs, and overall scope of the project during the initial visit.
Active
$850,000
655 Maple St, Brooklyn, NY 11203
4beds
1,500sqft
Single Family Residence
Built in 1910
-- sqft lot
$853,400 Zestimate®
$567/sqft
$-- HOA
What's special
- 28 days |
- 1,078 |
- 24 |
Likely to sell faster than
Zillow last checked:
Listing updated:
Listed by:
Bond New York 347-410-0838,
Shloma Hecht
Source: StreetEasy,MLS#: S1830439
Loading...
Facts & features
Interior
Bedrooms & bathrooms
- Bedrooms: 4
- Bathrooms: 2
- Full bathrooms: 2
Features
- Has fireplace: No
Interior area
- Total structure area: 1,500
- Total interior livable area: 1,500 sqft
Property
Details
- Parcel number: 047950069
- Special conditions: Resale
Construction
Type & style
- Home type: SingleFamily
- Property subtype: Single Family Residence
Condition
- Year built: 1910
Community & HOA
Community
- Subdivision: Wingate
Location
- Region: Brooklyn
Financial & listing details
- Price per square foot: $567/sqft
- Tax assessed value: $769,000
- Annual tax amount: $2,971
- Date on market: 5/27/2026
Estimated market value
$853,400
$811,000 - $896,000
$4,073/mo
Price history
| Date | Event | Price |
|---|---|---|
| 5/27/2026 | Listed for sale | $850,000$567/sqft |
Source: StreetEasy #S1830439 Report a problem | ||
| 5/22/2026 | Listing removed | $850,000$567/sqft |
Source: StreetEasy #S1817645 Report a problem | ||
| 3/24/2026 | Listed for sale | $850,000+17.2%$567/sqft |
Source: StreetEasy #S1817645 Report a problem | ||
| 5/13/2022 | Sold | $725,000-5.8%$483/sqft |
Source: Public Record Report a problem | ||
| 11/15/2021 | Listing removed | -- |
Source: StreetEasy Report a problem | ||
| 10/10/2021 | Price change | $770,0000%$513/sqft |
Source: StreetEasy Report a problem | ||
| 10/7/2021 | Price change | $770,001+0%$513/sqft |
Source: StreetEasy Report a problem | ||
| 8/19/2021 | Price change | $770,000-0.6%$513/sqft |
Source: StreetEasy Report a problem | ||
| 7/14/2021 | Listed for sale | $775,000+14.8%$517/sqft |
Source: StreetEasy Report a problem | ||
| 12/4/2013 | Listing removed | $675,000$450/sqft |
Source: Postlets Report a problem | ||
| 11/26/2013 | Listed for sale | $675,000$450/sqft |
Source: Postlets Report a problem | ||
| 11/4/2012 | Listing removed | $1,750$1/sqft |
Source: HAJONESREALTYANDMANAGEMENT Report a problem | ||
| 11/2/2012 | Listed for rent | $1,750$1/sqft |
Source: HAJONESREALTYANDMANAGEMENT Report a problem | ||
Public tax history
| Year | Property taxes | Tax assessment |
|---|---|---|
| 2025 | $2,971 +4.3% | $46,140 -2.4% |
| 2024 | $2,849 | $47,280 -14.4% |
| 2023 | -- | $55,260 +22.1% |
| 2022 | -- | $45,240 -2.6% |
| 2021 | -- | $46,440 +12.5% |
| 2020 | $662 +11.7% | $41,280 +14.9% |
| 2019 | $592 -75.3% | $35,940 +213.6% |
| 2018 | $2,398 +6.8% | $11,462 +4% |
| 2017 | $2,246 +213.9% | $11,016 +5.7% |
| 2016 | $715 | $10,419 +0.2% |
| 2015 | $715 +75.8% | $10,399 +5.6% |
| 2014 | $407 | $9,852 +3.1% |
| 2013 | -- | $9,552 +4.1% |
| 2012 | -- | $9,180 +5.7% |
| 2011 | -- | $8,683 +0.2% |
| 2010 | -- | $8,666 +5.6% |
| 2009 | -- | $8,210 +3.1% |
| 2008 | -- | $7,960 +4.1% |
| 2007 | -- | $7,650 +5.7% |
| 2006 | -- | $7,236 +0.2% |
| 2005 | -- | $7,222 +5.6% |
| 2004 | -- | $6,842 +3.1% |
| 2003 | -- | $6,634 +4.1% |
| 2002 | -- | $6,375 +5.7% |
| 2001 | -- | $6,030 +0.2% |
| 2000 | -- | $6,019 |
Find assessor info on the county website
Monthly payment
Estimated monthly payment$1,822
All calculations are estimates and provided by Zillow, Inc. for informational purposes only. Actual amounts may vary.
HOA fees may include property taxes on listings classified as Co-Ops. Contact the listing agent and/or owner for fee details.
Mortgage interest rates are dependent on a number of factors, including credit score, down payment, and repayment length. Interest rate data provided by Zillow Group Marketplace, Inc. as of 1/1/1970 from various mortgage lenders with which we have lead or other similar arrangements; the Estimated Payment is an average of those rates.
See how much you could borrow to make a competitive offer.
Climate risks
Neighborhood: Wingate
Nearby schools
GreatSchools rating
- 6/10Ps 91 The Albany Avenue SchoolGrades: PK-5Distance: 0.1 mi
- 4/10New Heights Middle SchoolGrades: 6-8Distance: 0.1 mi
- NASchool For Human RightsGrades: 9-12Distance: 0.3 mi

A local agent can set up tours, give advice and negotiate with sellers.


Nearby cities
Nearby neighborhoods
Nearby zip codes
Other New York Topics
