Welcome to 66055 San Jose Rd in Desert Hot Springs! This property offers a wonderful opportunity to enjoy the relaxed desert lifestyle while being surrounded by the natural beauty of the Coachella Valley.Located in Desert Hot Springs, the home provides convenient access to Palm Springs, local restaurants, shopping, golf, hiking, and the area's well-known mineral hot springs. Whether you're looking for a primary residence, weekend desert getaway, or investment opportunity, this property offers great potential.Enjoy beautiful desert surroundings, warm weather, and everything the Greater Palm Springs area has to offer. Come see the possibilities at 66055 San Jose Rd and make this desert property your own!
For sale
Price cut: $36K (11/4)
$323,000
66055 San Jose Rd, Desert Hot Springs, CA 92240
2beds
2baths
1,570sqft
Residential
Built in 1991
8,712 Square Feet Lot
$319,700 Zestimate®
$206/sqft
$-- HOA
What's special
- 52 days
- 270
- 4
Zillow last checked:
Listing updated:
Listed by:
Lorena Alvarado DRE # 02023071 760-989-1646,
Luxury Collective 424-395-4841
Source: CLAW,MLS#: 26994283
Facts & features
Interior
Bedrooms & bathrooms
- Bedrooms: 2
- Bathrooms: 2
Interior area
- Total structure area: 1,570
- Total interior livable area: 1,570 sqft
Property
Parking
- Total spaces: 2
Features
- Stories: 1
Lot
- Size: 8,712 Square Feet
Details
- Parcel number: 639062005
- Zoning: R1
Construction
Type & style
- Home type: SingleFamily
- Architectural style: Modern
- Property subtype: Residential
Condition
- Year built: 1991
Community & HOA
HOA
- Has HOA: No
Location
- Region: Desert Hot Springs
Financial & listing details
- Price per square foot: $206/sqft
- Tax assessed value: $403,258
- Date on market: 9/29/2026
Estimated market value
$319,700
$304,000 - $336,000
$2,321/mo
Price history
| Date | Event | Price |
|---|---|---|
| 11/4/2026 | Price change | $323,000-10%$206/sqft |
Source:  CLAW #26994283 Report a problem | ||
| 9/29/2026 | Listed for sale | $359,000-5.5%$229/sqft |
Source: CLAW #26994283 Report a problem | ||
| 12/22/2022 | Sold | $380,000+204%$242/sqft |
Source: Public Record Report a problem | ||
| 8/5/2015 | Sold | $125,000$80/sqft |
Source: Public Record Report a problem | ||
| 5/20/2015 | Pending sale | $125,000$80/sqft |
Source: Vista Realty #15893191PS Report a problem | ||
| 5/14/2015 | Price change | $125,000+25.1%$80/sqft |
Source: Vista Realty #15893191PS Report a problem | ||
| 5/1/2015 | Pending sale | $99,900$64/sqft |
Source: Vista Realty #15893191PS Report a problem | ||
| 5/1/2015 | Listed for sale | $99,900-20.1%$64/sqft |
Source: Vista Realty #15893191PS Report a problem | ||
| 1/23/2002 | Sold | $125,000+78.6%$80/sqft |
Source: Public Record Report a problem | ||
| 7/28/1994 | Sold | $70,000-42.9%$45/sqft |
Source: Public Record Report a problem | ||
| 5/23/1994 | Sold | $122,658$78/sqft |
Source: Public Record Report a problem | ||
Public tax history
| Year | Property taxes | Tax assessment |
|---|---|---|
| 2026 | -- | $403,258 +2% |
| 2025 | $5,971 -1.6% | $395,352 +2% |
| 2024 | $6,070 -1% | $387,600 +2% |
| 2023 | $6,132 +101.2% | $380,000 +172.5% |
| 2022 | $3,048 -3.3% | $139,435 +2% |
| 2021 | $3,152 +2.9% | $136,702 +1% |
| 2020 | $3,063 +1.7% | $135,301 +2% |
| 2019 | $3,011 +3.1% | $132,649 +2% |
| 2018 | $2,922 +1.8% | $130,049 +2% |
| 2017 | $2,871 | $127,500 +2% |
| 2016 | $2,871 +26.4% | $125,000 -9.4% |
| 2015 | $2,272 +3.7% | $138,000 +5.3% |
| 2014 | $2,191 | $131,000 +26% |
| 2013 | -- | $104,000 +15.6% |
| 2012 | -- | $90,000 -6.3% |
| 2011 | -- | $96,000 +9.1% |
| 2010 | -- | $88,000 -14.6% |
| 2009 | -- | $103,000 -26.7% |
| 2008 | -- | $140,581 +2% |
| 2007 | -- | $137,826 +2% |
| 2006 | -- | $135,124 +2% |
| 2005 | -- | $132,476 +3.9% |
| 2003 | -- | $127,500 +26% |
| 2002 | -- | $101,202 +31.4% |
| 2001 | $1,018 +0.7% | $77,000 |
| 2000 | $1,010 | $77,000 |
Find assessor info on the county website
Monthly payment
Est. payment
Payment breakdown
Explore the cost of this home by adjusting the details. Changes won't be saved.Climate risks
Neighborhood: 92240
- $370,2003 bd3 ba1.6k sqft66051 San Jose Rd, Desert Hot Springs, CA 92240Off Market
- $363,0003 bd2 ba1.5k sqft66061 San Jose Rd, Desert Hot Springs, CA 92240Off Market
- $426,1003 bd2 ba1.7k sqft66025 San Jose Rd, Desert Hot Springs, CA 92240Off Market

- $377,4003 bd2 ba1.7k sqft66073 San Jose Rd, Desert Hot Springs, CA 92240Off Market

Similar homes
- $355,0003 bd2 ba1.2k sqft66351 San Juan Rd, Desert Hot Springs, CA 92240For Sale
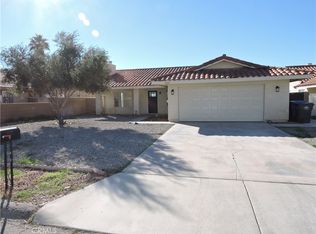 MLS ID #IG26239959, David Renney, BENNION DEVILLE HOMES. CRMLS
- $339,0003 bd2 ba1.3k sqft13595 Cuyamaca Dr, Desert Hot Springs, CA 92240For Sale
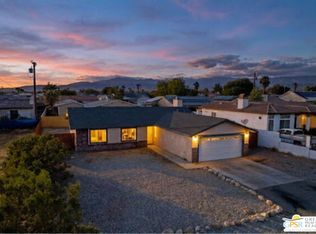 MLS ID #26108566PS, Dale Line DRE # 02104185, Brix Realty Group. CLAW
- $325,0003 bd2 ba2k sqft64586 Spyglass Ave, Desert Hot Springs, CA 92240For Sale
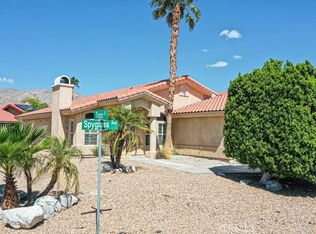 MLS ID #IG26204125, Judith Sailors, EXP REALTY OF CALIFORNIA INC.. CRMLS
- $355,0003 bd2 ba1.7k sqft66656 San Marcus Rd, Desert Hot Springs, CA 92240For Sale
 MLS ID #260017023, Patty Reyes, Century 21 Affiliated. SDMLS
